Product Assurance Run-time – Quality Prediction Designer

General Description
The Product Assurance Runtime objective is to perform actions to ensure the quality and suitability of a product, based on the data obtained in the manufacturing process, and/or in the quality inspection of the products once they are finished. Internally, the Product Assurance Runtime is divided in two different tasks:
Product Quality Prediction
Product Quality Supervision
Both tasks are based on Artificial Intelligence (AI) and Big Data techniques. However, the approach varies as the desired results are different, and the techniques, or the way they are applied, will also be different.
This documentation is part of the Product Quality Prediction task, and the following sections focus on the description of specific features, requirements, and use of the Quality Prediction Designer.
The main purpose of this component is to design and train Machine Learning models with the goal to prepare and select trained models, mainly in supervised scenarios; these will be later used for the prediction of product quality. This is achieved integrating machine learning libraries and other analytical and graphical tools.
| Resource | Location |
|---|---|
| Online documentation | Link |
| Open API Spec | N/A - The component is designed to be a ML training developer interface for quality prediction. Deployed models for final inference and related APIs will be managed within AI Analytics Runtime |
| Video | ZDMP Virtual Academy Technical Training Webinar (from 1h 23’) |
Screenshots
The following images are illustrative screen shots of the component.
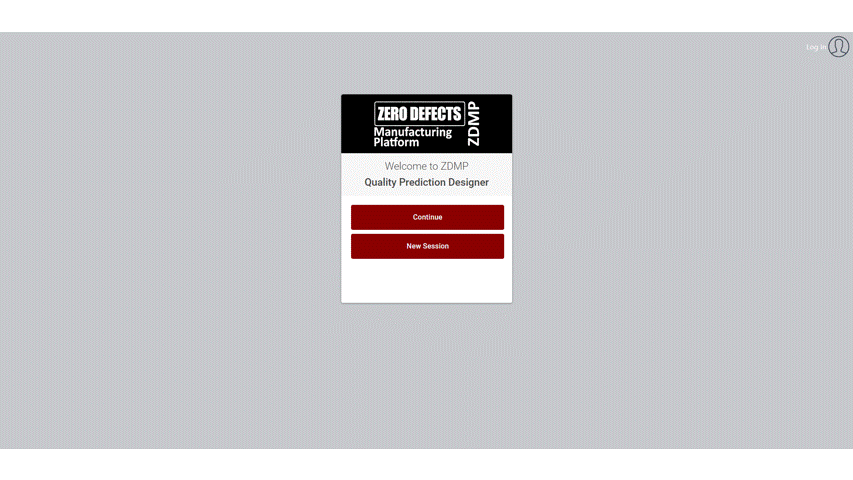
Figure 1. Quality Prediction Designer
Component Author(s)
| Company Name | ZDMP Acronym | Website | Logo |
|---|---|---|---|
| Video Systems Srl. | VSYS | videosystems.it |  |
Commercial Information
| Resource | Location |
|---|---|
| IPR Link | VSYS AI quality predictor |
| Marketplace product description | link |
Architecture Diagram
The following diagram shows the position of this component in the ZDMP architecture.
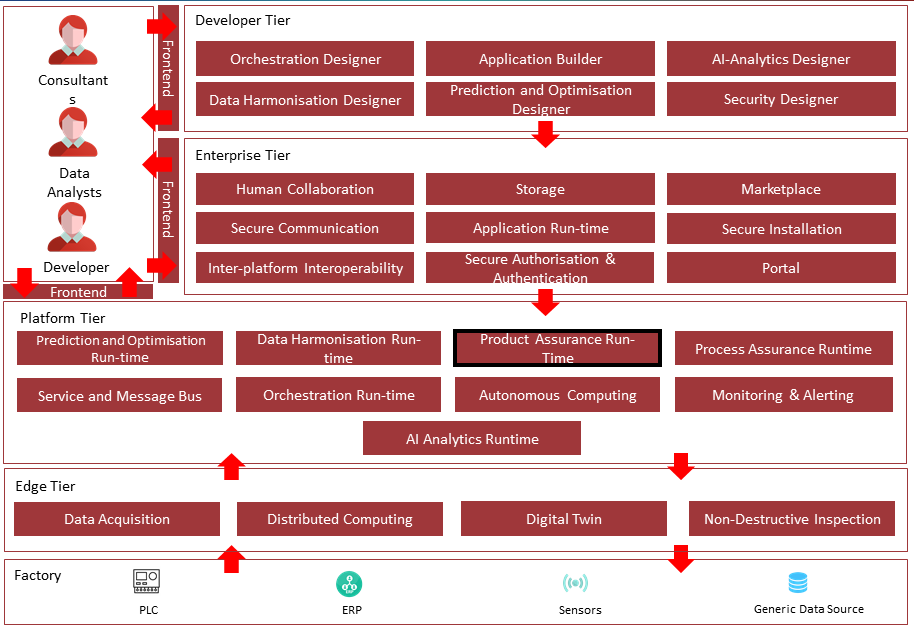
Figure 2. Position of Component in ZDMP Architecture
Benefits
Dataset management
Friendly user interface to train and optimize a model
Experiments tracking
Visualization tools to analyse the model
Save results from experiments
Export the model for run-time prediction
Features
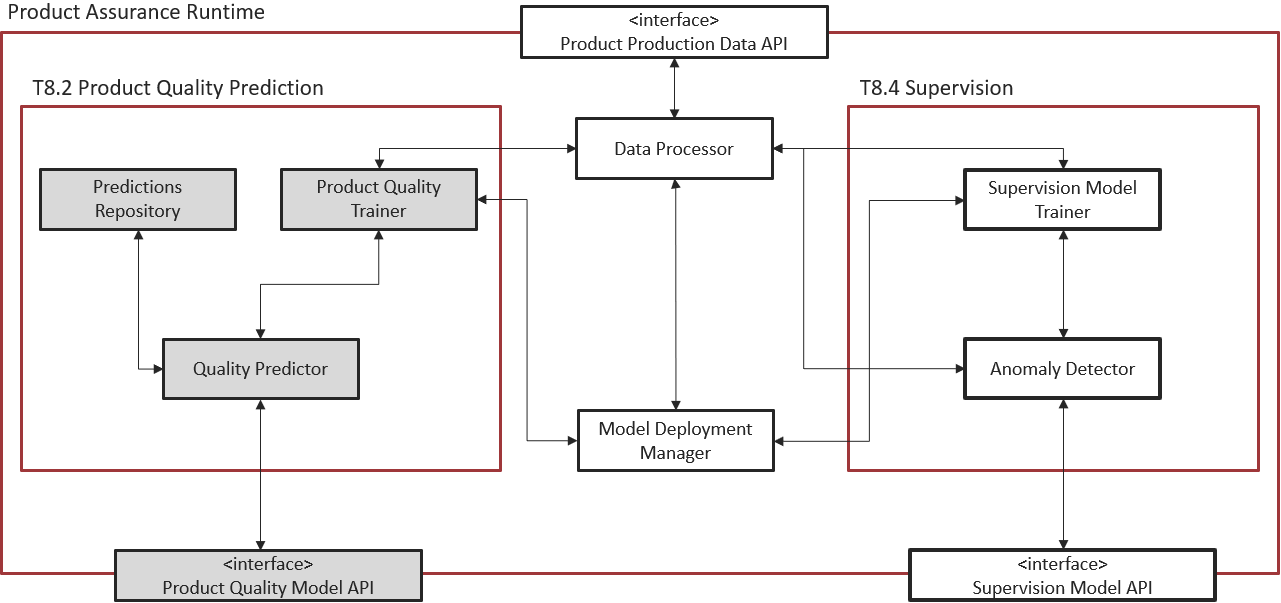
Figure 3. Subsystem architecture of Product Quality Prediction task inside the Product Assurance Runtime
The objective of the Product Quality Prediction task is to provide real time predictions about the product quality variables of a manufacturing process through Machine Learning Models and Big Data techniques.
The primary idea of the component is to provide a Web UI, the Quality Prediction Designer, integrating in the backend a ML engine, to allow the user to build a trained model for future quality predictions in both classification and regression scenarios. Since many classical models need to be parametrized (hyperparameters) this component also provides an optimization process. After the model has been trained the user can analyse the results using some analytical tools provided by this component. At the end, the user can export the trained model and call it to make predictions.
Thus, the Product Quality Prediction task is split into two phases:
Training
Inference, ie prediction at run-time
Training
The Web UI provides a pipeline to build and train a Machine Learning model from scratch. The key features can be grouped as follow:
Data Manager and Pre-processing: It is possible to choose how to allocate and manipulate the dataset before training the model on it
Model Configuration and Run Experiment: Selecting a model available in the component it is possible to configure it with the default parameters or made a custom configuration. The model configuration is divided in two forms:
The Model Parameters form groups the main parameters of the selected model. The configuration is set to default, but it is also possible to change the parameters selecting either a single value or a range of values (Figure 4). In this case the optimizer will search the best parameter to improve the metric selected in the optimizer form (Figure 5).
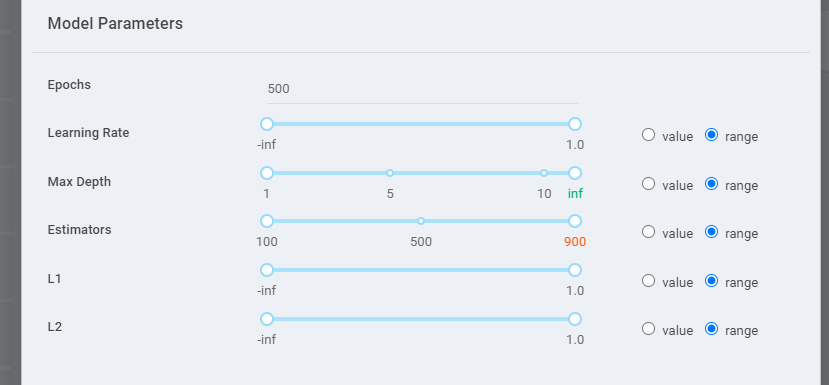
Figure 4. Model Parameters form
The Optimizer form groups the main parameters to run the optimizer on the selected model as, for example, the maximum number of trials or the metric with respect to perform the optimization (Figure 5). The algorithms are based on the scikit-optimize library (See https://scikit-optimize) and the search space can include Categorical, Real and Integer variables, depending on the model parameters.
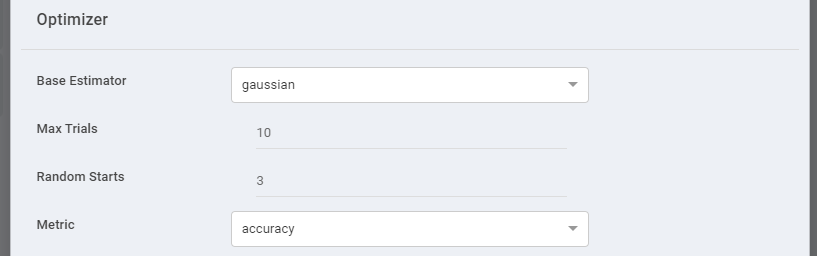
Figure 5. Optimizer form
- Analysis Tools: Once an experiment is completed, it is possible to see a selection of main information like in Figure 6, with an example of a classification problem. Different representations can also be chosen, for example in Figure 7, the predicted classes are represented in a sunburst graph and in a confusion matrix. It is also possible to select a set of trials to compare the behaviour of each trained model, as explained below in the “How to use” section.
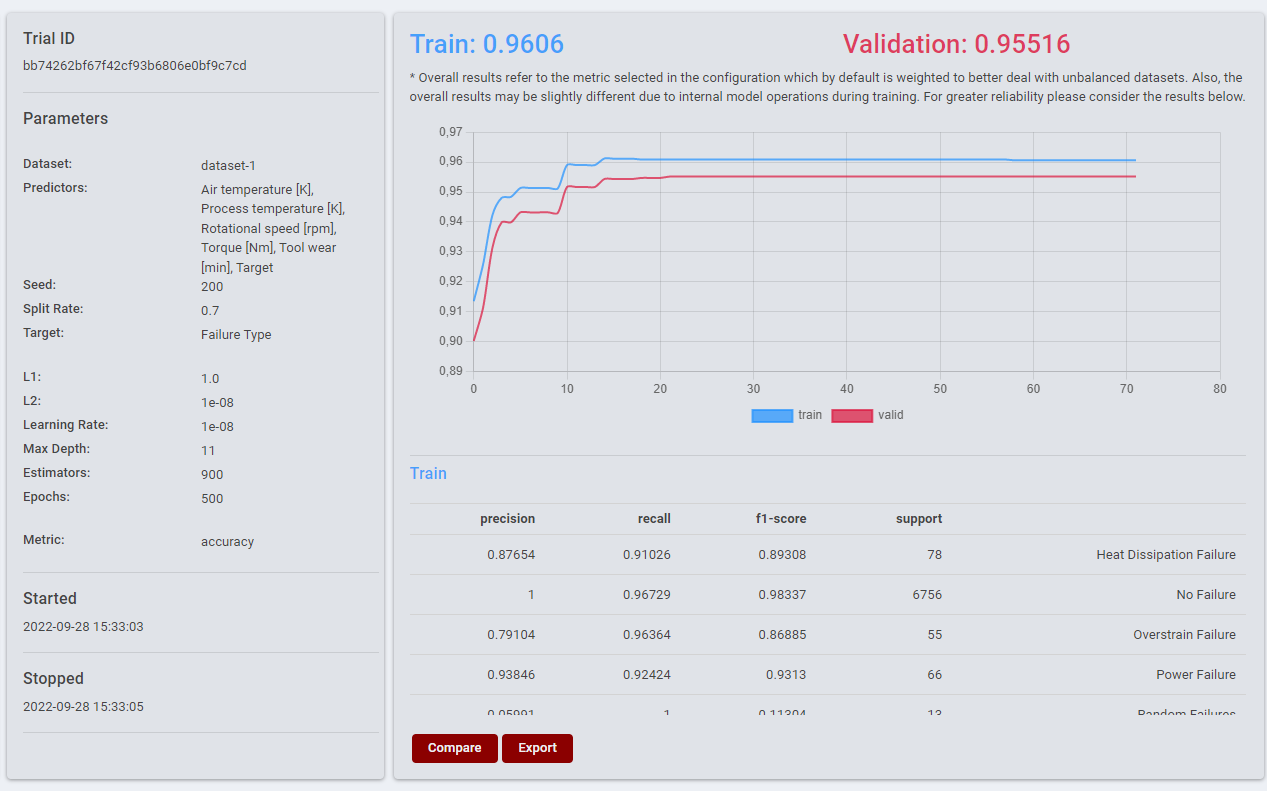
Figure 6. Model Results
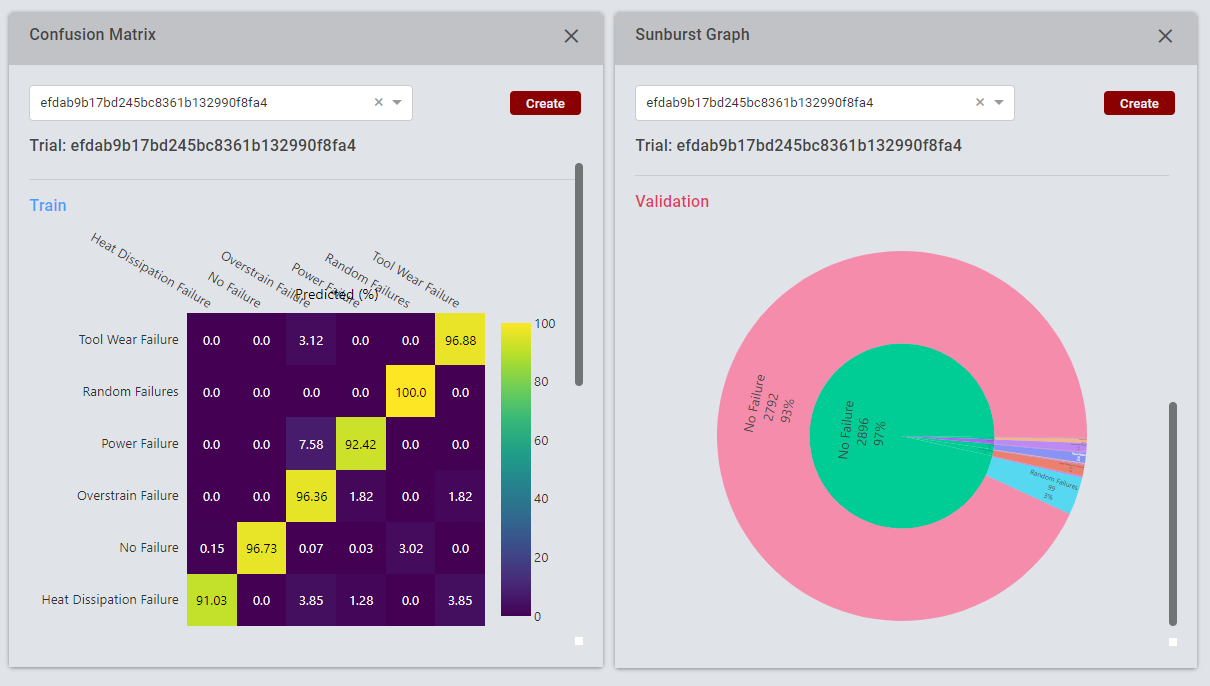
Figure 7. Confusion Matrix and Sunburst graph
Inference
Once the model is trained, it is possible to use it in a run-time scenario to make predictions. The Web UI allows the user to export any model and create the archive model.zip; this can be then uploaded by means of the Model Deployment Manager sub-component and used to finally deploy the trained model through the AI Analytics Runtime component. For more information, see the sections related to the Model Deployment Manager inside the Product Assurance Runtime – Supervision documentation in particular the How to use section.
System Requirements
The component is expected to be used inside the ZDMP platform and is so managed by the Application Runtime. All the component’s software requirements are automatically resolved.
| Hardware |
|---|
| 2+ CPUs |
| 8GB+ RAM |
| 1GB+ disk |
Associated ZDMP services
Required
Secure Authentication and Authorisation: This is needed to secure the communication between components and authorize API calls
Portal: Needed to access all services within the platform, centralizing the authentication procedure
Marketplace: The modules created by developers may be uploaded to the Marketplace. Users can then buy modules based on their needs and those modules will be available in the component
Application Runtime: To build and run the component
AI Analytics Runtime: To deploy the trained models and run them online with streaming data input
Product Assurance Runtime: In particular, the Model Deployment Manager is the main frontend to upload the trained model and refine the manifest file with all the instructions needed by the AI Analytics Runtime
Installation
Once bought in the Marketplace, the component is available for installation through the Secure Installation component. Some installation variables can be set:
“Private Registry Settings”
“Private Registry URL”: the ZDMP container registry URL
“Private registry user/password”: the login for the ZDMP container registry
“Portal Public URI”
“Companies Persistence”
“The PersistentVolume type”: local or nfs
“The Companies Storage size”: size of the Companies Storage Volume
“AccessMode”: leave default
“StorageClassName”: leave default
“PersistentVolumeReclaimPolicy”: leave default
“HostPath for same node installations”: if “Volume Type” is local, this indicates the path on the node to the Volume
“NFS Server URL”: if “The PersistentVolume type” is nfs, this is the URL to the NFS Server
“NFSPath for multiple nodes installations”: if “The PersistentVolume type” is nfs, this is the path where to setup the Volume
“Ingress”
“Enable Ingress”: enable Ingress
“Ingress Host”: URL of the component
“Ingress Path”: leave default
How to use
This quality prediction is divided in two phases:
Training
Inference
In the Training phase the user can build, train, and analyse any model available in the Web UI of the Quality Prediction Designer. Users can upload their datasets and configure some model parameters. Default mode and advanced mode are provided so that the model can be configured according to user’s level of knowledge.
In the Inference phase the user will deploy the trained model in a run-time scenario. For this step, the user can export as an output of the training phase a .zip file containing the trained model, the source code and the related requirements needed to run it. Next, the user needs to configure the model deployment via the Model Deployment Manager component (Product Assurance Runtime – Quality Supervision) to finally run it via the AI Analytics Runtime component.
Training
The Web UI allows the user to upload a dataset and train a model from scratch following this simple pipeline.
- Data Manager
The user can create multiples datasets and fill it uploading .csv files with the same data structure. It is also possible to visualize the data.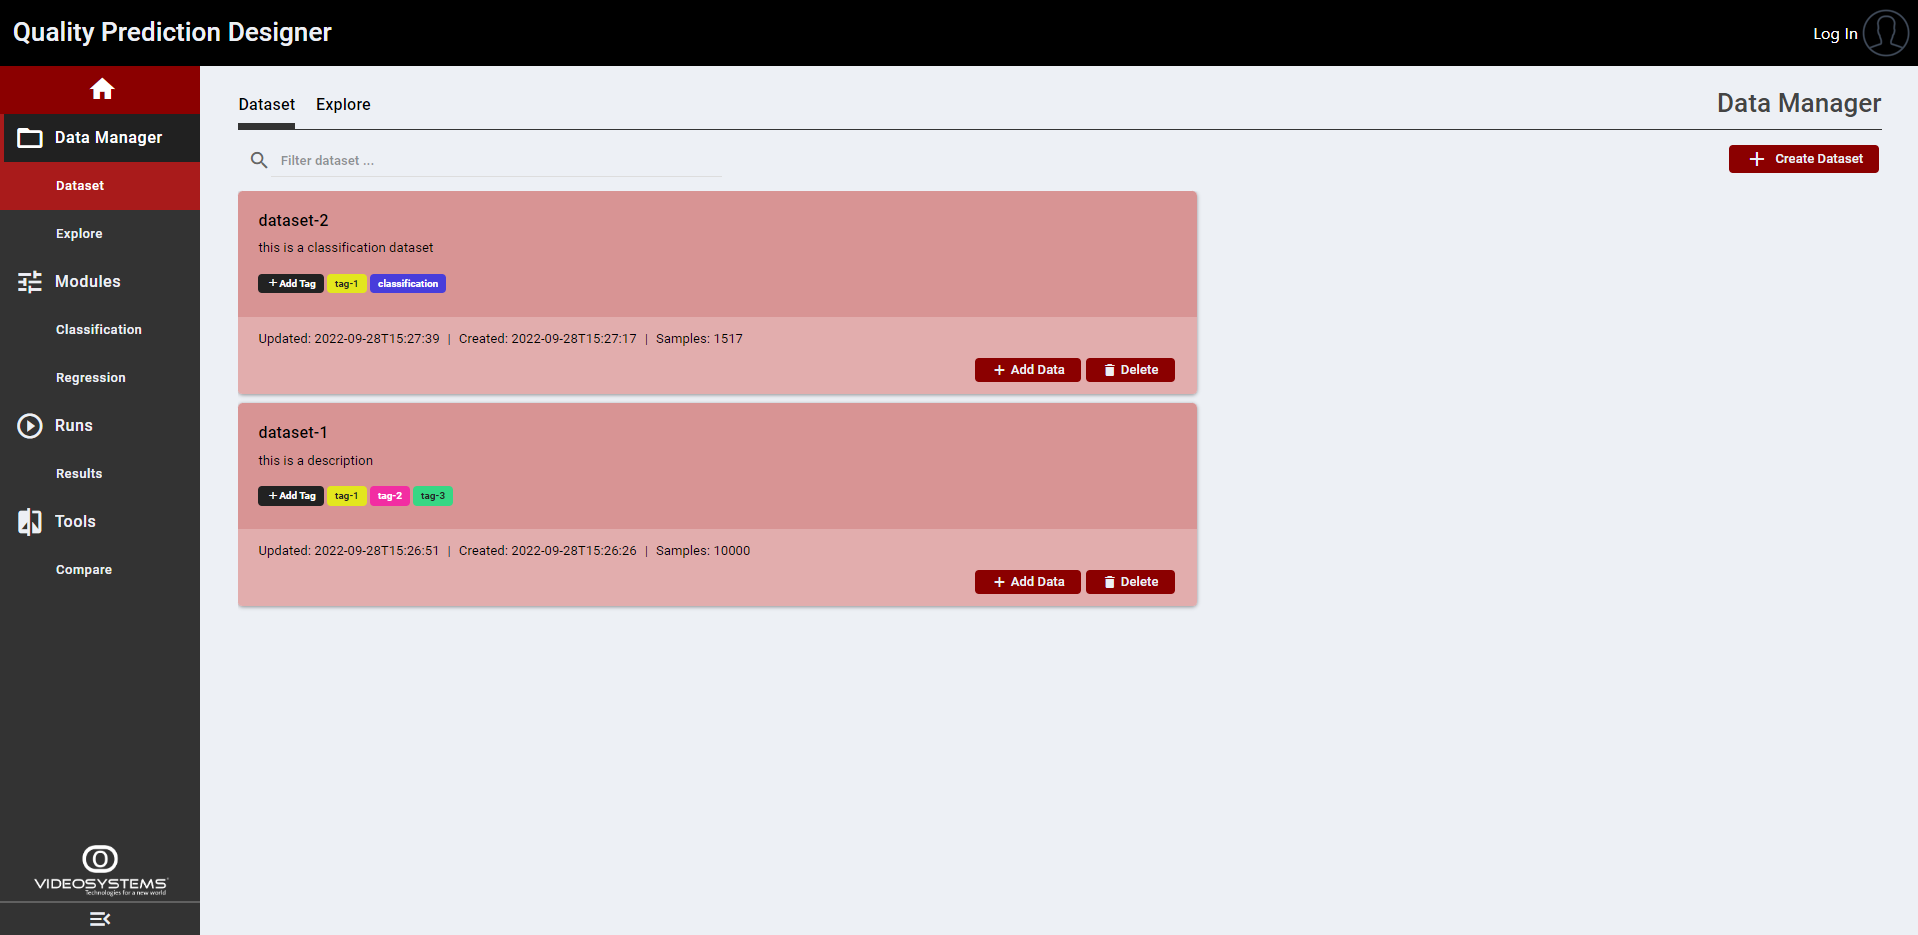
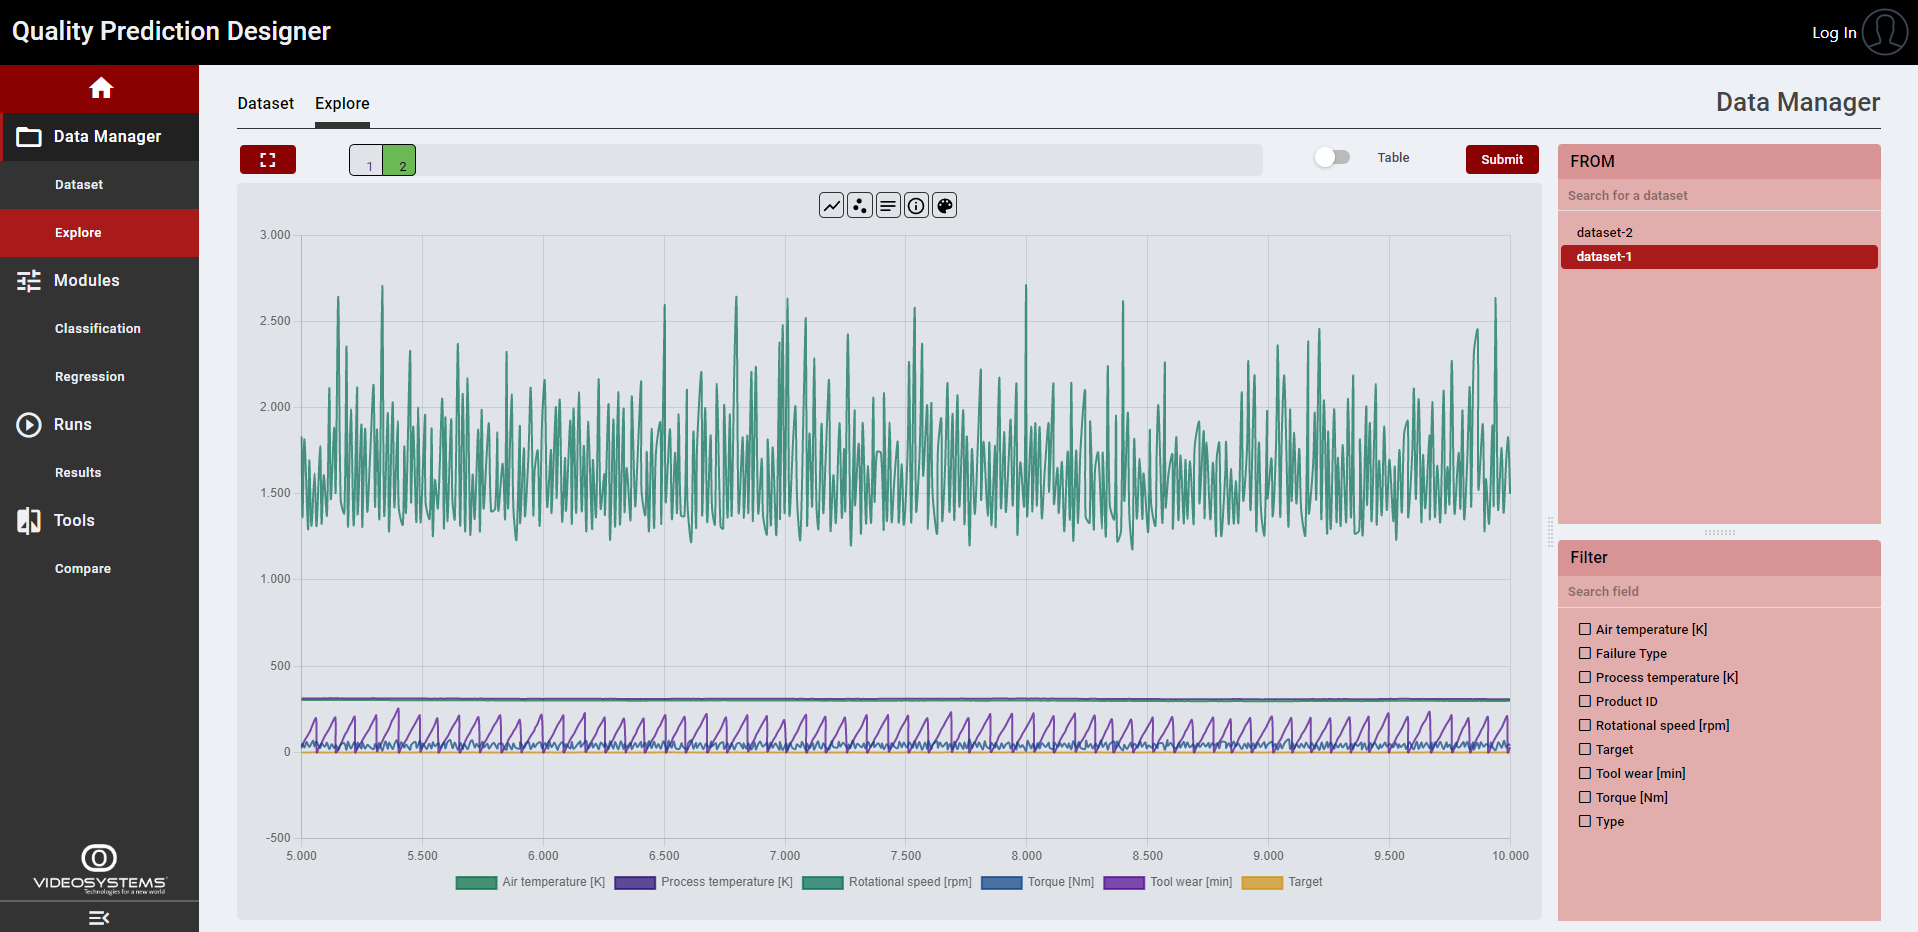
Figure 8. Data Manager, Dataset and Explore page
- Model Configuration
In this page the user can visualize the available techniques whit respect to the task selected, add, and configure an experiment in a straightforward way, and see the status after it has been launched.
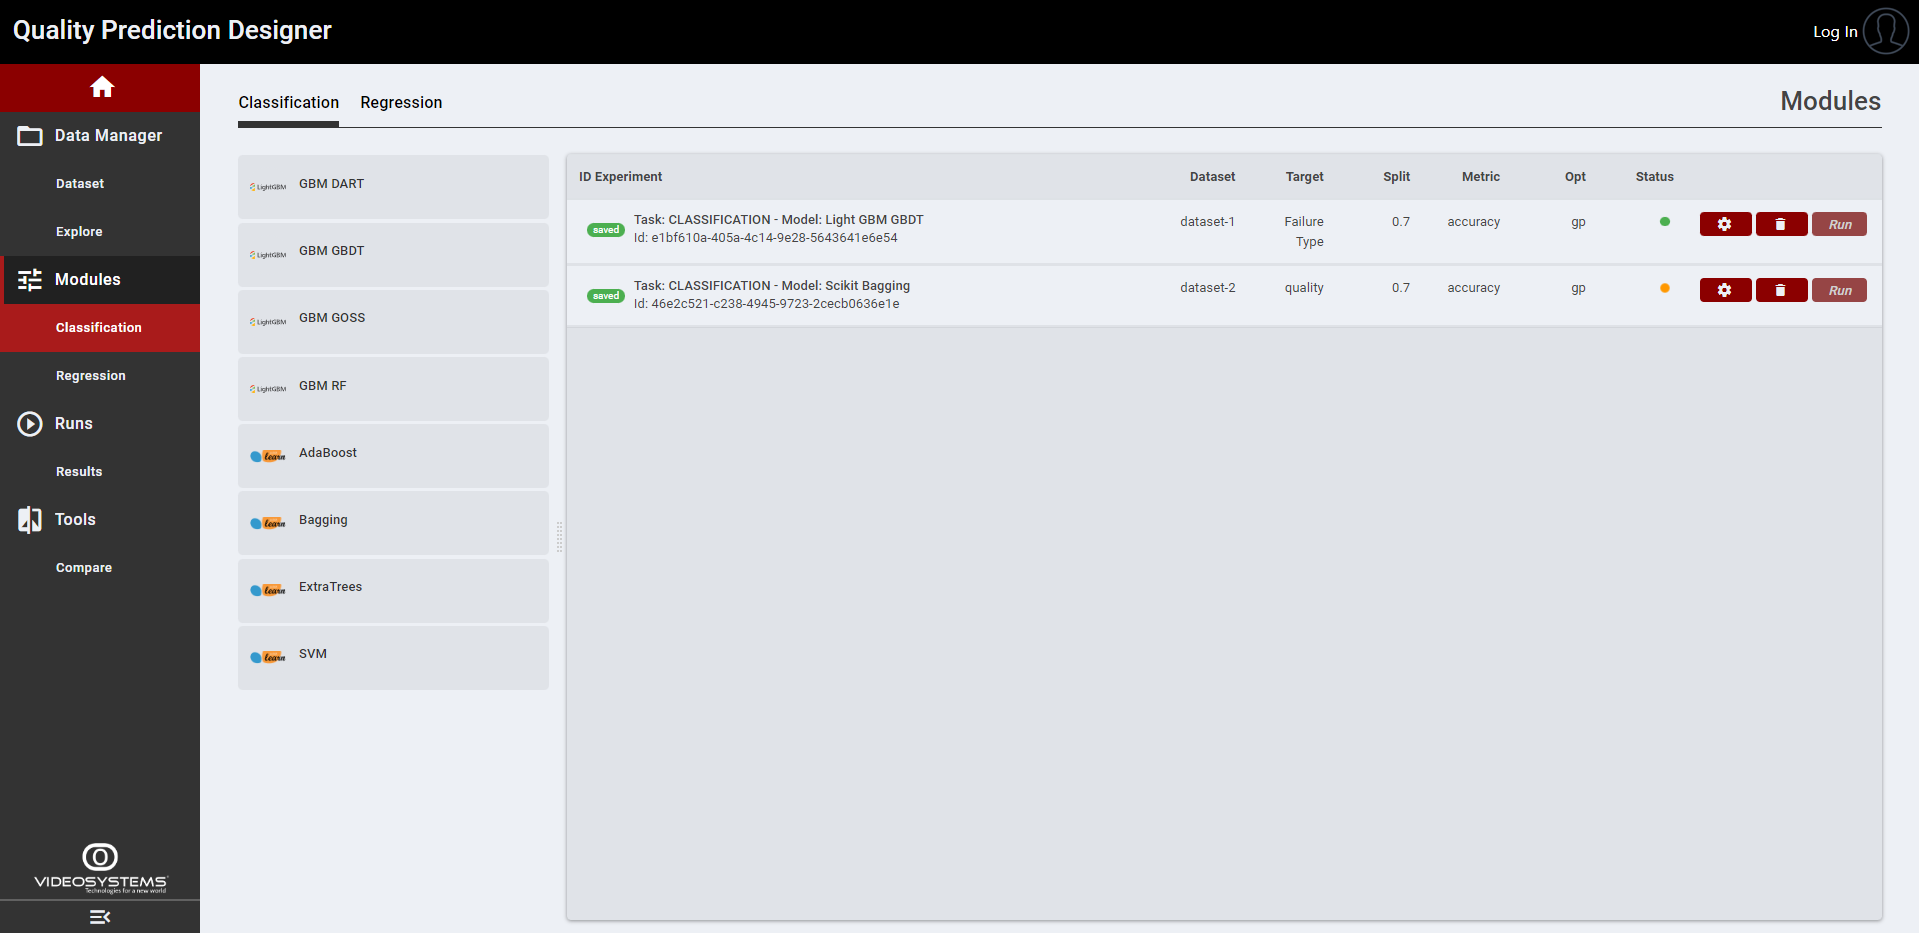
Figure 9. Model Configuration page
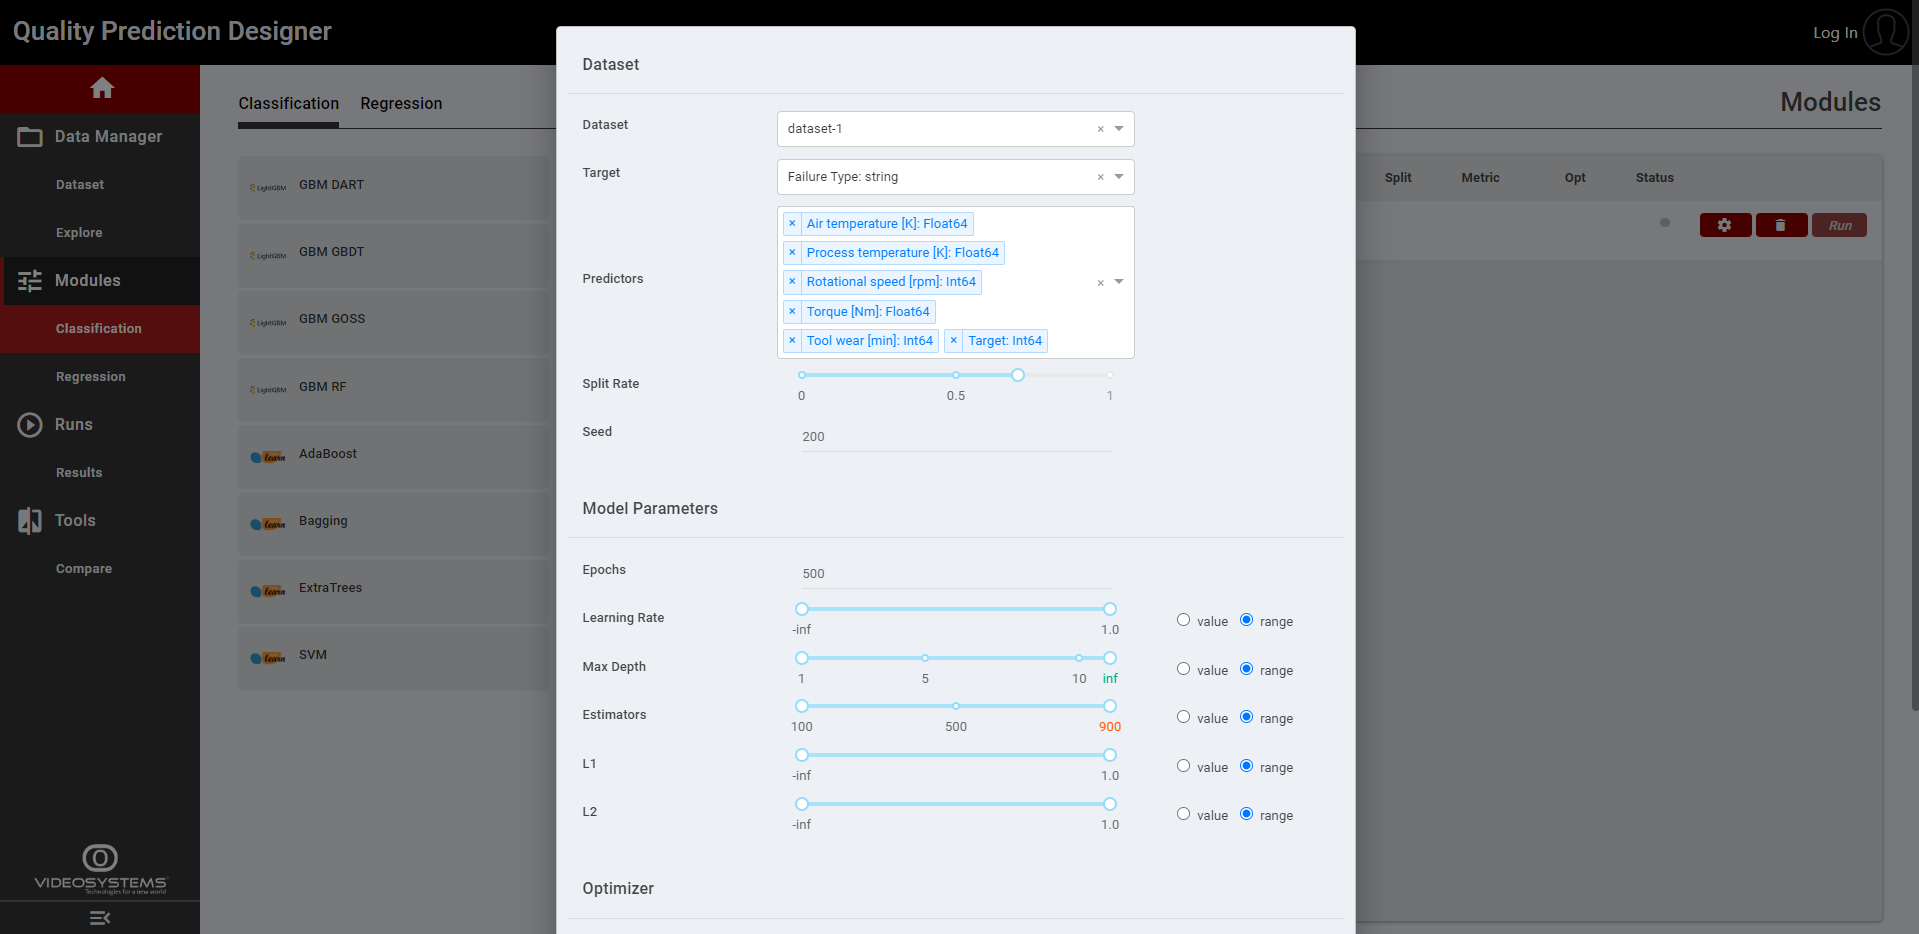
Figure 10. Example of experiment configuration
Is possible to add to the list of experiments multiple models, also the same model multiple times, just clicking on the models available on the left side.
Each model/experiment can be launched in two ways:
If the user selects the default configuration or configures the model with fixed values, then a single experiment/trial will be launched, and no optimization is provided
If the user configures the model with some range parameter (Figure 10), then multiple trials will be launched in the experiment. In this case the optimizer will try to optimize the model within the search space defined by the selected range of values. In this case it is also possible to configure some optimizer parameters and select the metric with respect to the optimizer will work
Each experiment configuration needs to be saved before running it.
- Running Experiments
At this point, the user can launch the experiments just clicking the RUN button (Figure 9) and then monitor the status of each experiment (Figure 11).
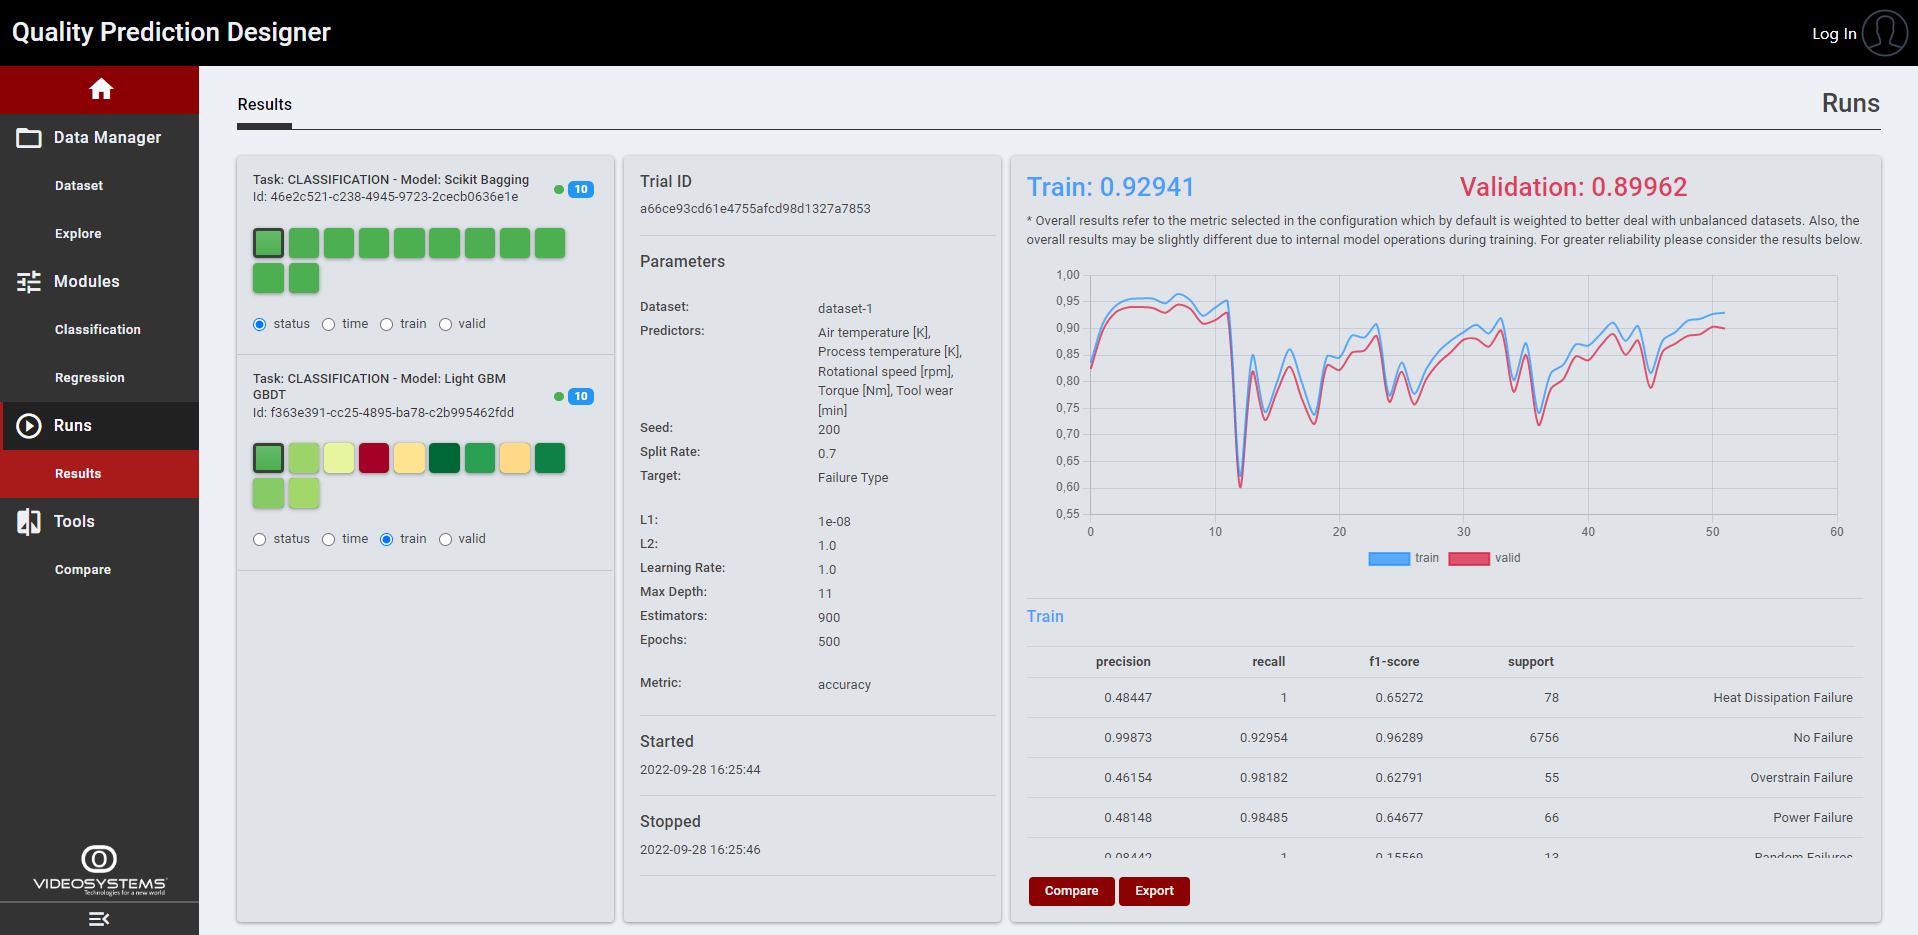
Figure 11. List of experiments and relative trials
As shown in the figure it is possible to see more than one trial (represented by coloured blocks) inside an experiment. This is due to the fact that the optimizer is running and generating a number of trials equal or smaller than the number of max trials provided during the configuration (Figure 9).
The user can see the status and some results of each trial, plus some visualization features, like the colour gradient based on training, validation, or time criteria, to allow a quick selection of best trials.
The interface also reports details on how the optimizer has worked, all the steps to achieve the best configuration for the model (Figure 12. Optimizer results).
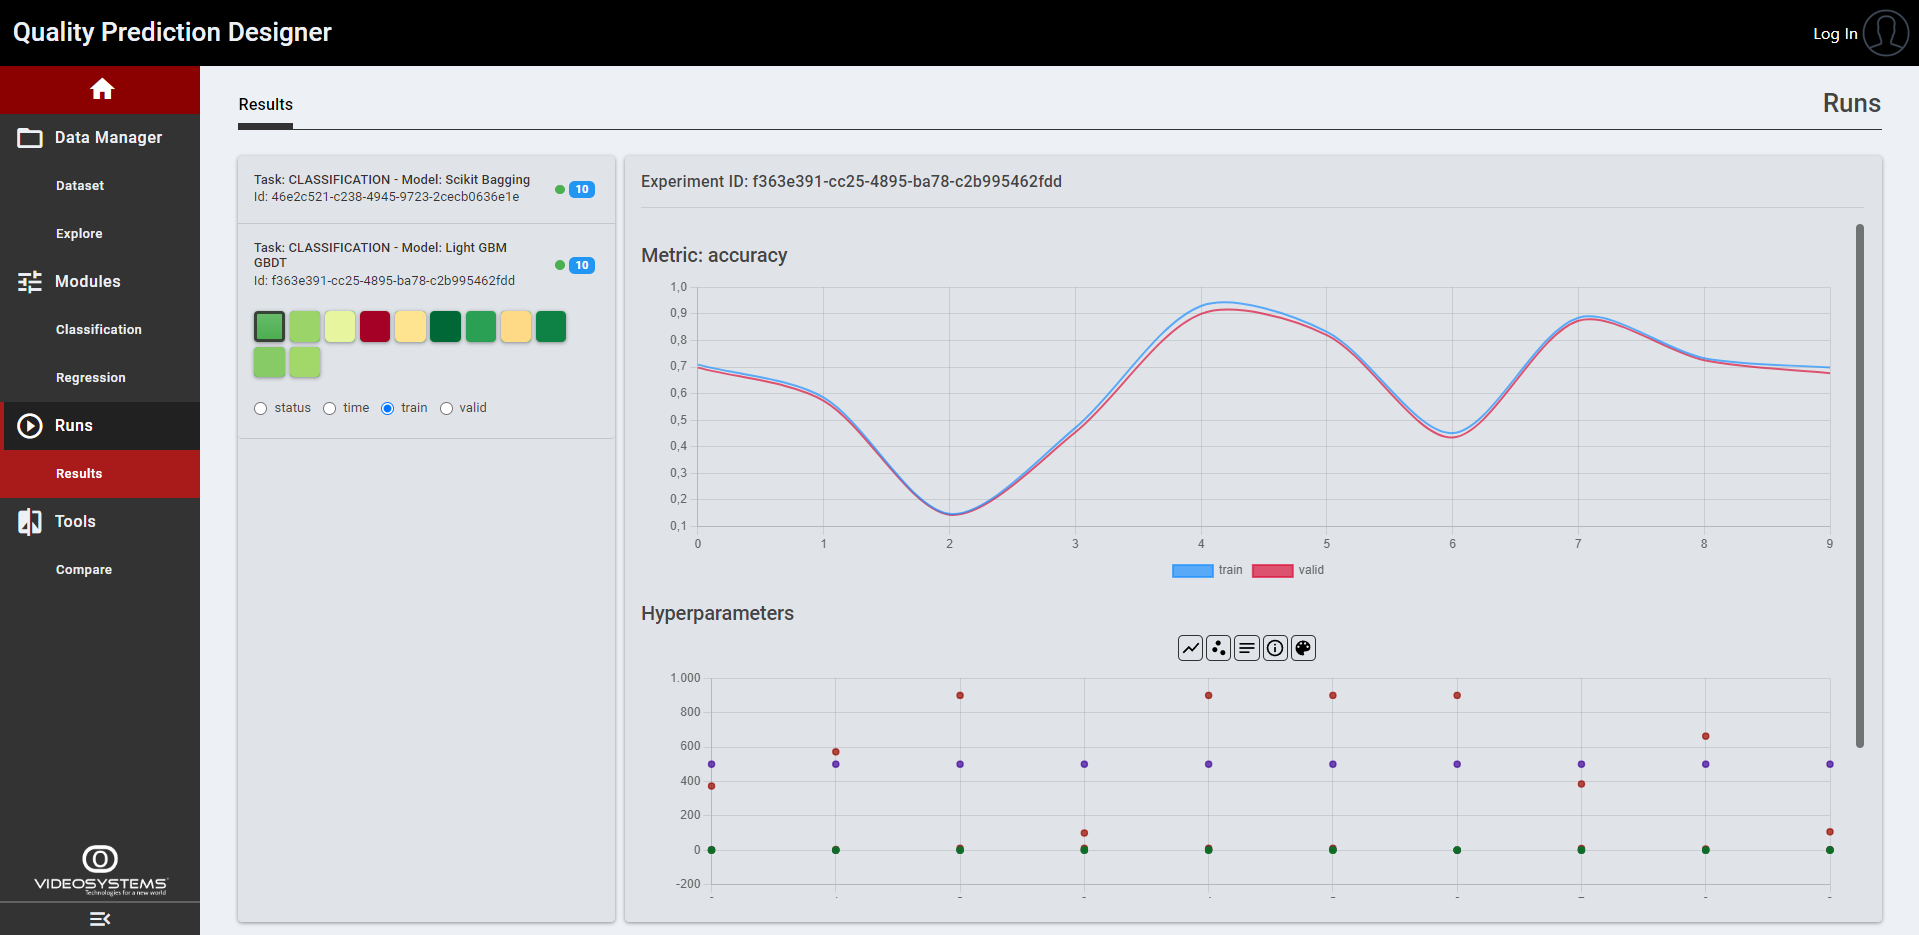
Figure 12. Optimizer results
- Further Analysis
This page provides further detailed results on those trials successfully concluded and selected with the “Compare” button (Figure 11). Clicking the tool cards listed on the left, the user can add all the cards needed (Figure 13), each one representing a specific graphical tool which shows how the model is performing with the datasets, having feedback on its behaviour.
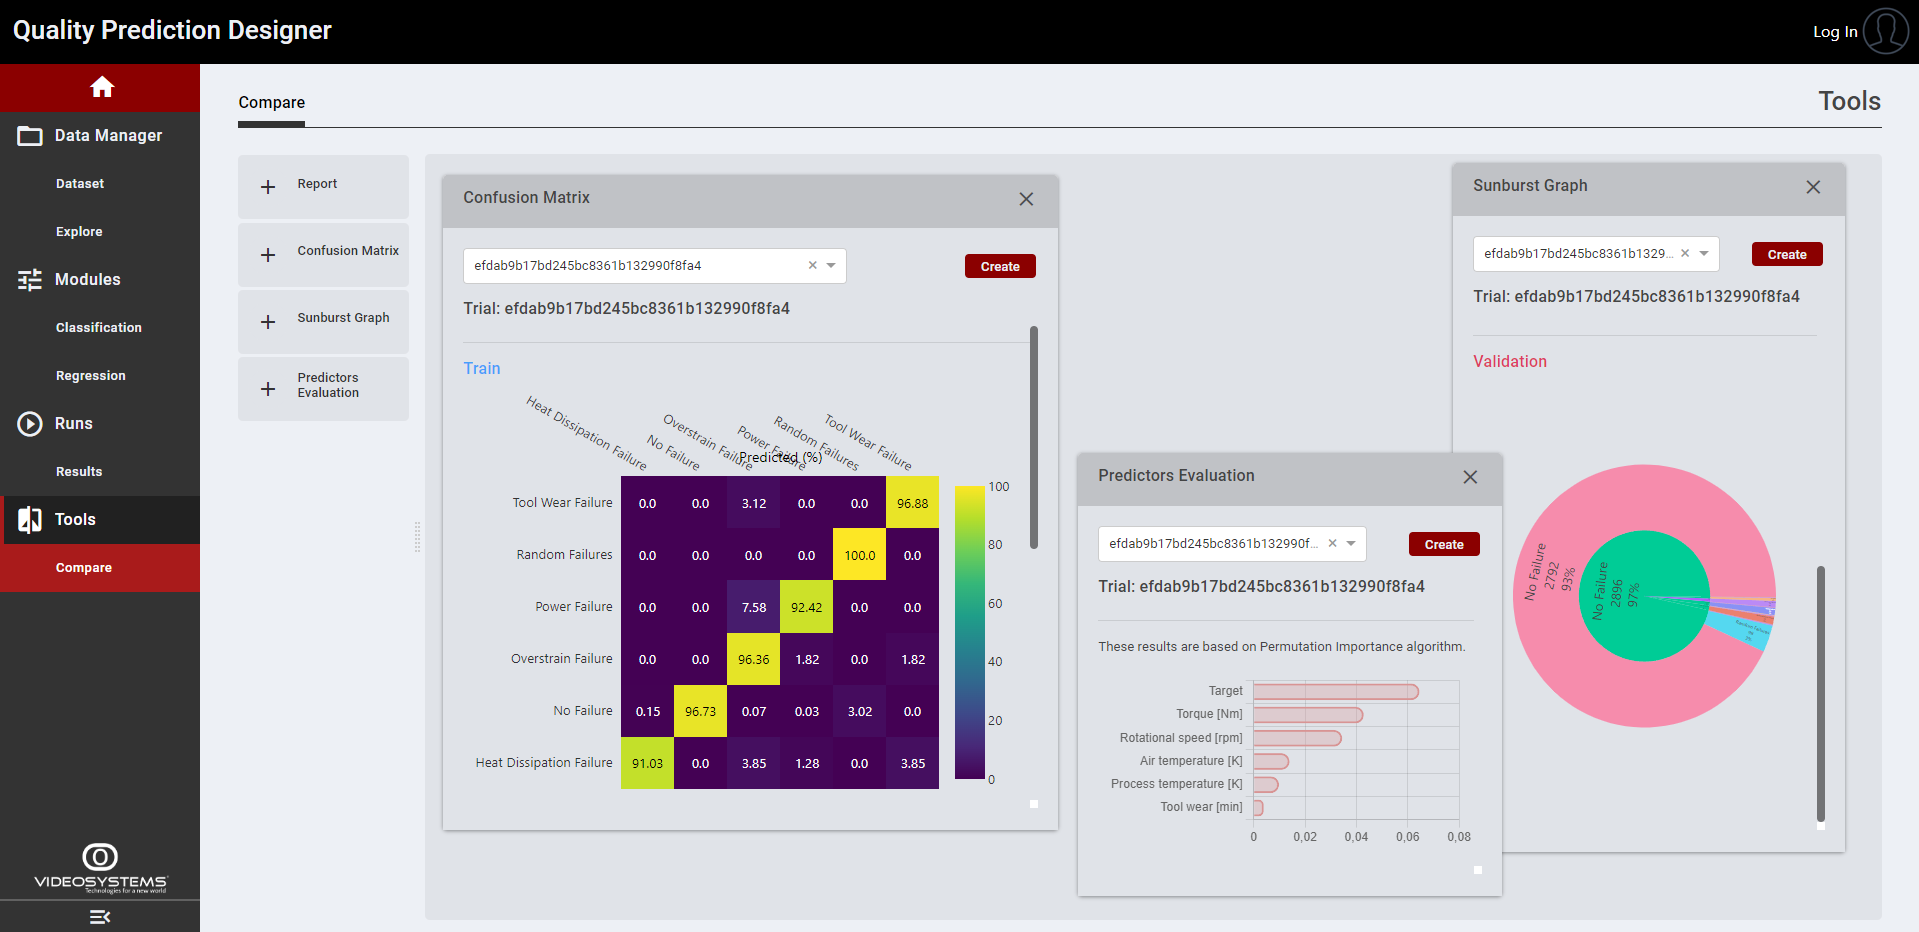 Figure 13. Compare results
In this way, it is also possible to compare two or more trials just selecting them through the list of the tool cards (Figure 14).
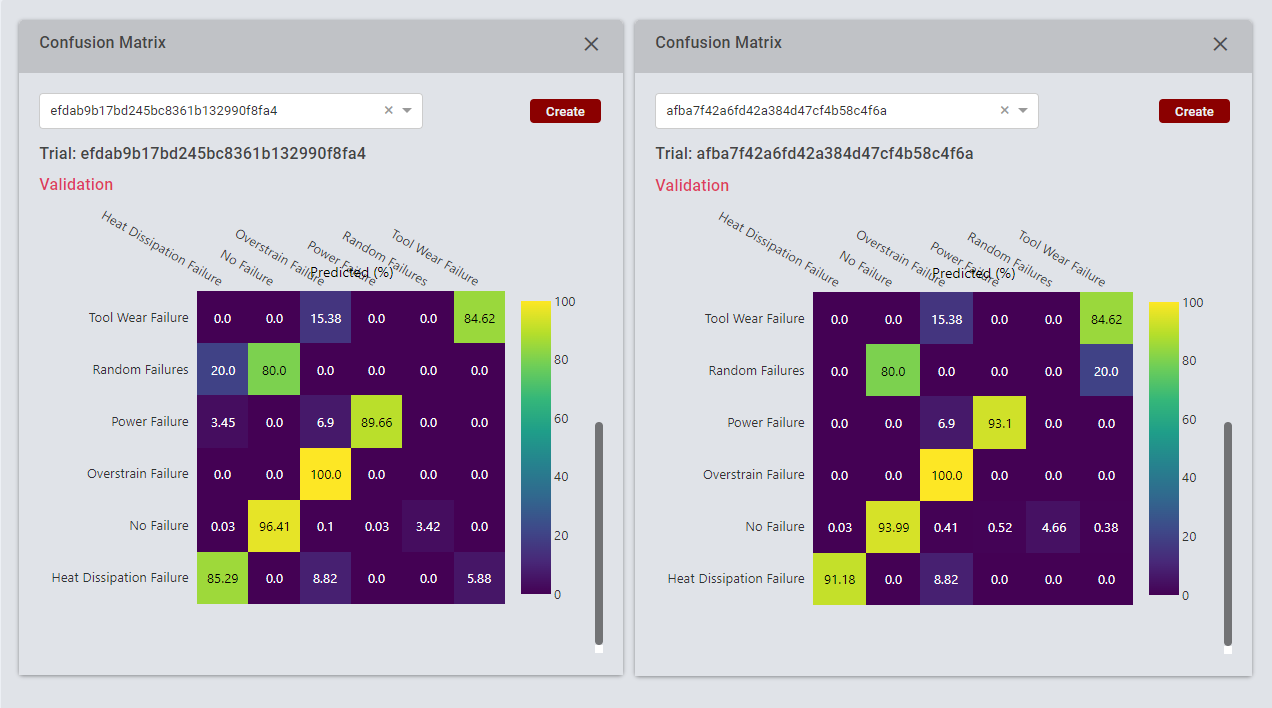
Figure 14. Confusion matrix comparison
Furthermore, each model can be inspected thanks to Predictors Evaluation Tool that allow to understand how the predictors affect the model prediction (Figure 15. Features Importance).
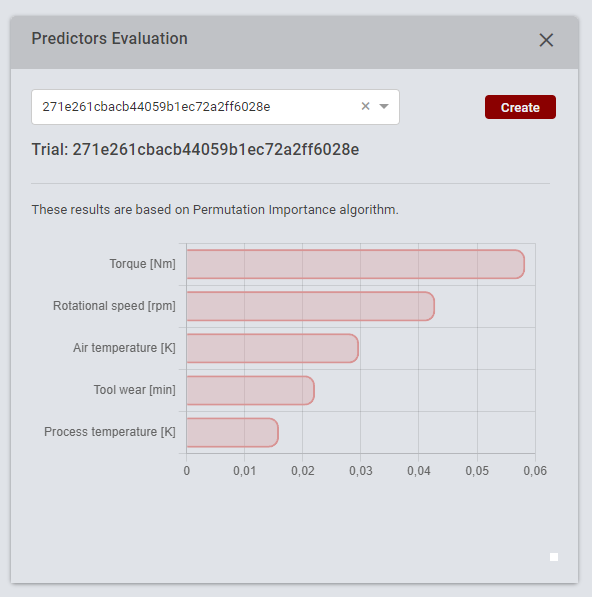
Figure 15. Features Importance
Export Model
Each trial corresponds to a trained model, and it is possible to export a .zip file (Figure 16. Export Form) for its future deployment, see the next section for more details.
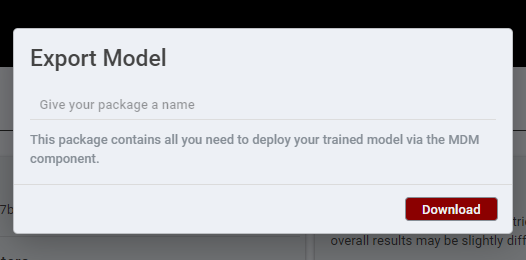
Figure 16. Export Form
The exported .zip package contains the following files:
model.pkl: It is the trained model’s pipeline that includes any operation on dataset.
predict.py: It contains the code to load and run the .pkl model stored in the .zip; in particular, there is a prediction function that using the model runs the prediction on the fed data. It is important to respect the variables order as used in the training phase.
requirements.txt: It contains the list of the python packages needed to run the model.
model_in_out.json: a dictionary containing the model’s inputs and output with relative types.
{
“output”: {
“Failure Type”: “string”
},
“input”: {
“Air temperature [K]": “Float64”,
“Process temperature [K]": “Float64”,
“Rotational speed [rpm]": “Int64”,
“Torque [Nm]": “Float64”,
“Tool wear [min]": “Int64”
}
}
```
Inference
How to test
In case a manual test of the exported model is to be run, the user needs to install the list of python packages present in the requirements.txt file and then just create an instance with python3.6:
``` python
from predict import predict
```
Now, to make a prediction, there is a schema to follow. The predict function accept two parameters data and s_model.
s_model =  "model.pkl"

data = [{
    "product_id": id,
    "product_data": [val_0, val_1, val_2, ...]
}]

#or

data = [{
    "product_id": id,
    "product_data": {
        "key0": val_0,
        "key1": val_1,
        "key2": val_2,
    }
}]

s_model = "model.pkl" (need for testing, but no needed in the runtime)

prediction = predict(data, s_model)
```
The output of prediction has the following schema
``` python
prediction = [
    {
        'product_id': id,
        'product_pred': {
            'Target_Name': 'Target_Prediction'
        }
    }
]
```
To predict more than one input at the same time just pass to data a list of dictionaries formatted as before.
After the model has been configured in Model Deployment Manager and deployed in the AI Analytics Runtime the data argument will be the same when you will publish the data via mqtt.
The following example shows exactly how to send a correct MQTT message to trigger a response:
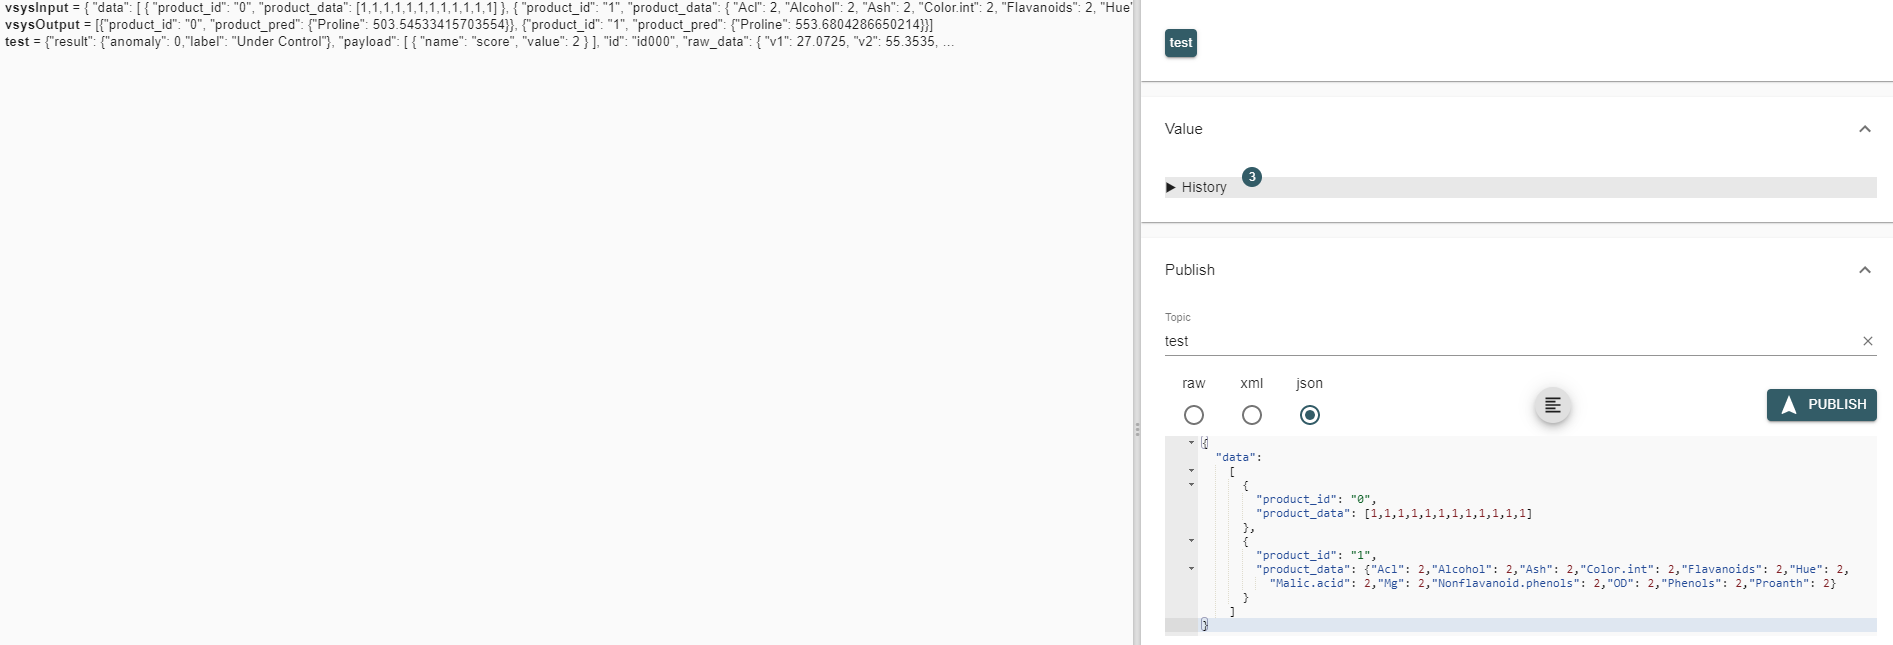
Figure 17. MQTT message / response example
The message was published in the topic vsysInput, which was the name selected for the input when configuring the model in the Model Deployment Manager, and the system returned an output in the topic vsysOutput, a name also chosen when configuring the model.
The message is a json which must follow the schema written above:
{
	“data”: [
{
   		"product_id": “id1”,
   		"product_data": [val_0, val_1, val_2, ...]
		},
{
   		"product_id": “id2”,
   		"product_data": {“key0”: val_0, “key1”: val_1, ...]
		},
]
}
```
How to deploy
To deploy a model in a run-time scenario within ZDMP environment, the user needs to rely upon other ZDMP components, namely the AI Analytics Runtime which needs a package, again a .zip file, with all the instructions and contents to properly run the model. This information can be summarised in:
Model and source code (src folder)
Manifest file for inputs and outputs configuration (manifest.json)
The first requirement is the src folder corresponding to the content of the model.zip package already created when a user exports a trained model from the Quality Prediction Designer.
The second requirement is the manifest.json file attached to the src package via the Model Deployment Manager (See relevant How to use section). In the Model Deployment Manager, which is the common entry point for many ML technologies available in the platform, the user should first upload the available model.zip from the UPLOAD page (Figure 18) once Python has been selected in the previous page to identify the ML technology type to be deployed.
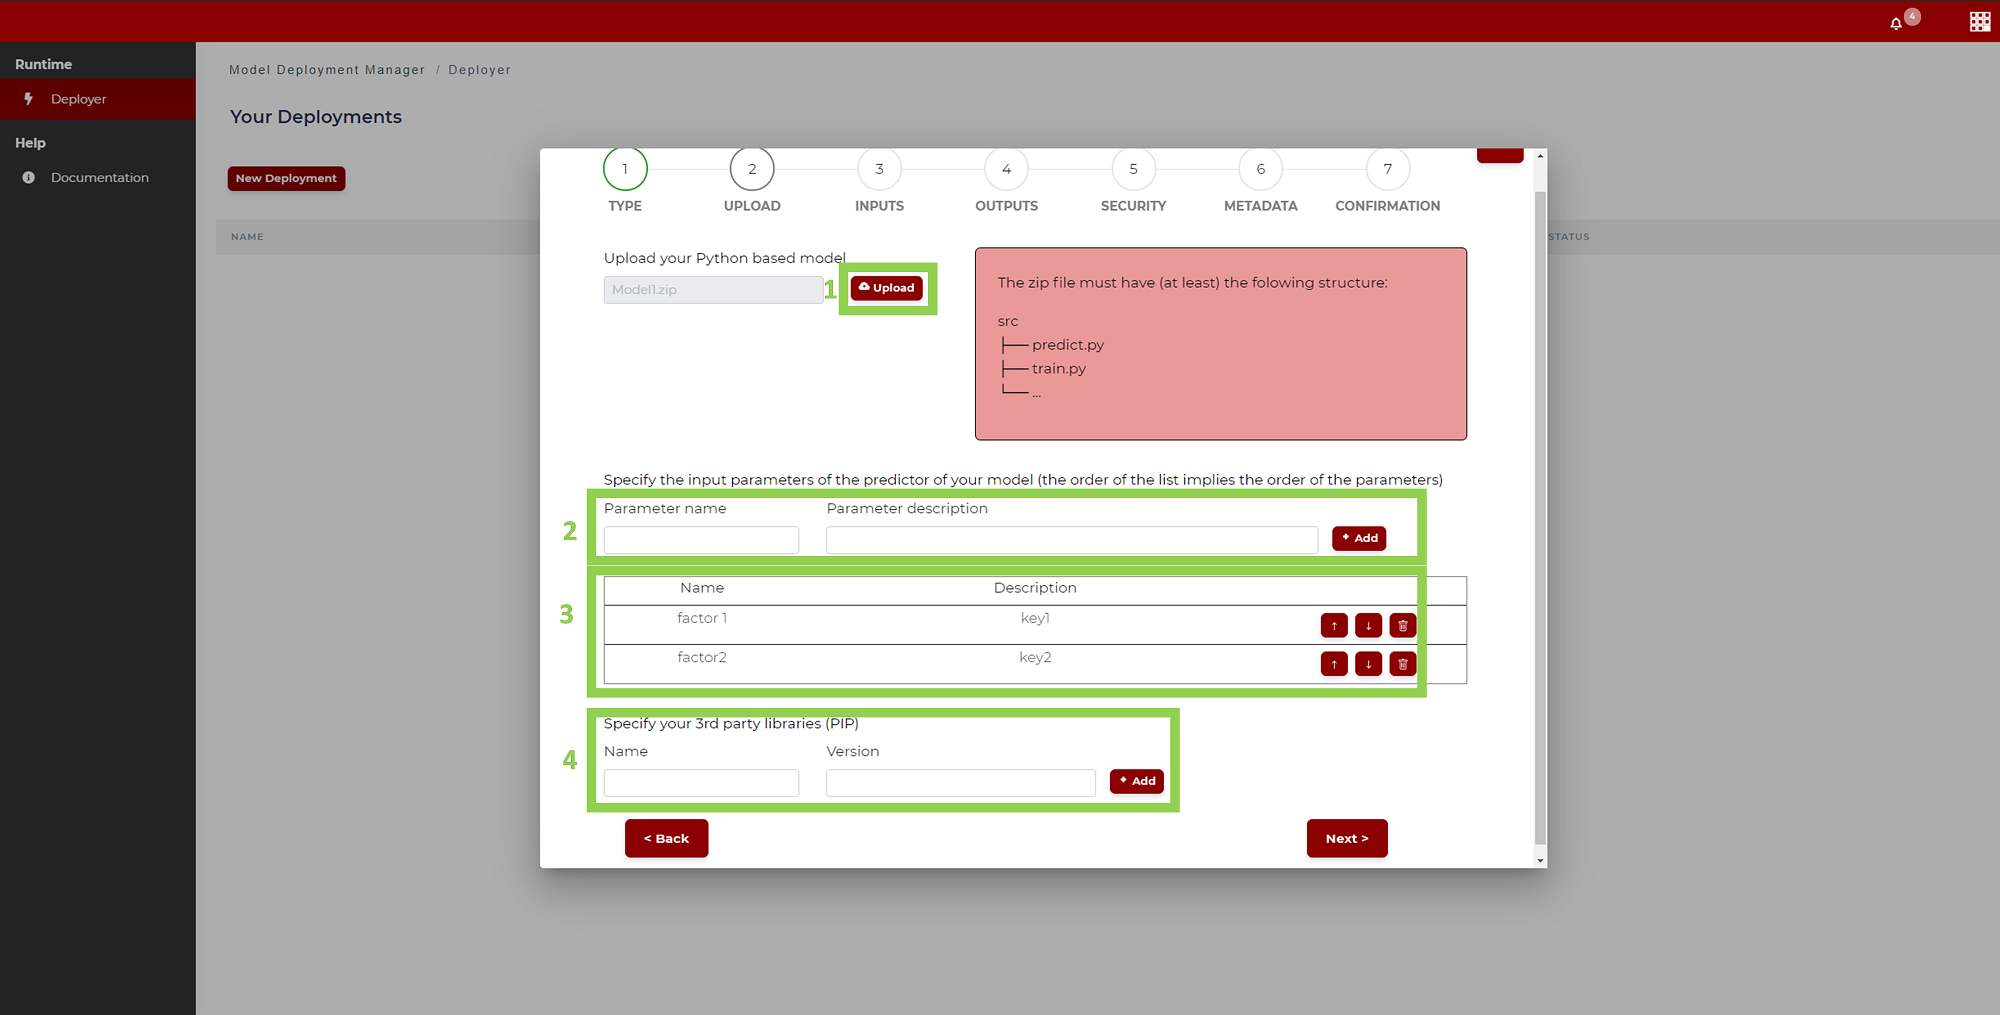
Figure 18. Model Deployment Manager - Python Model Uploading
Going through the page sequence to be filled in the Model Deployment Manager, the manifest file is automatically prepared: it contains metadata and instructions for the model deployment in the AI-Analytics Runtime, in particular how to select the input and output data sources to run the model (Figure 19. Model Deployment Manager).
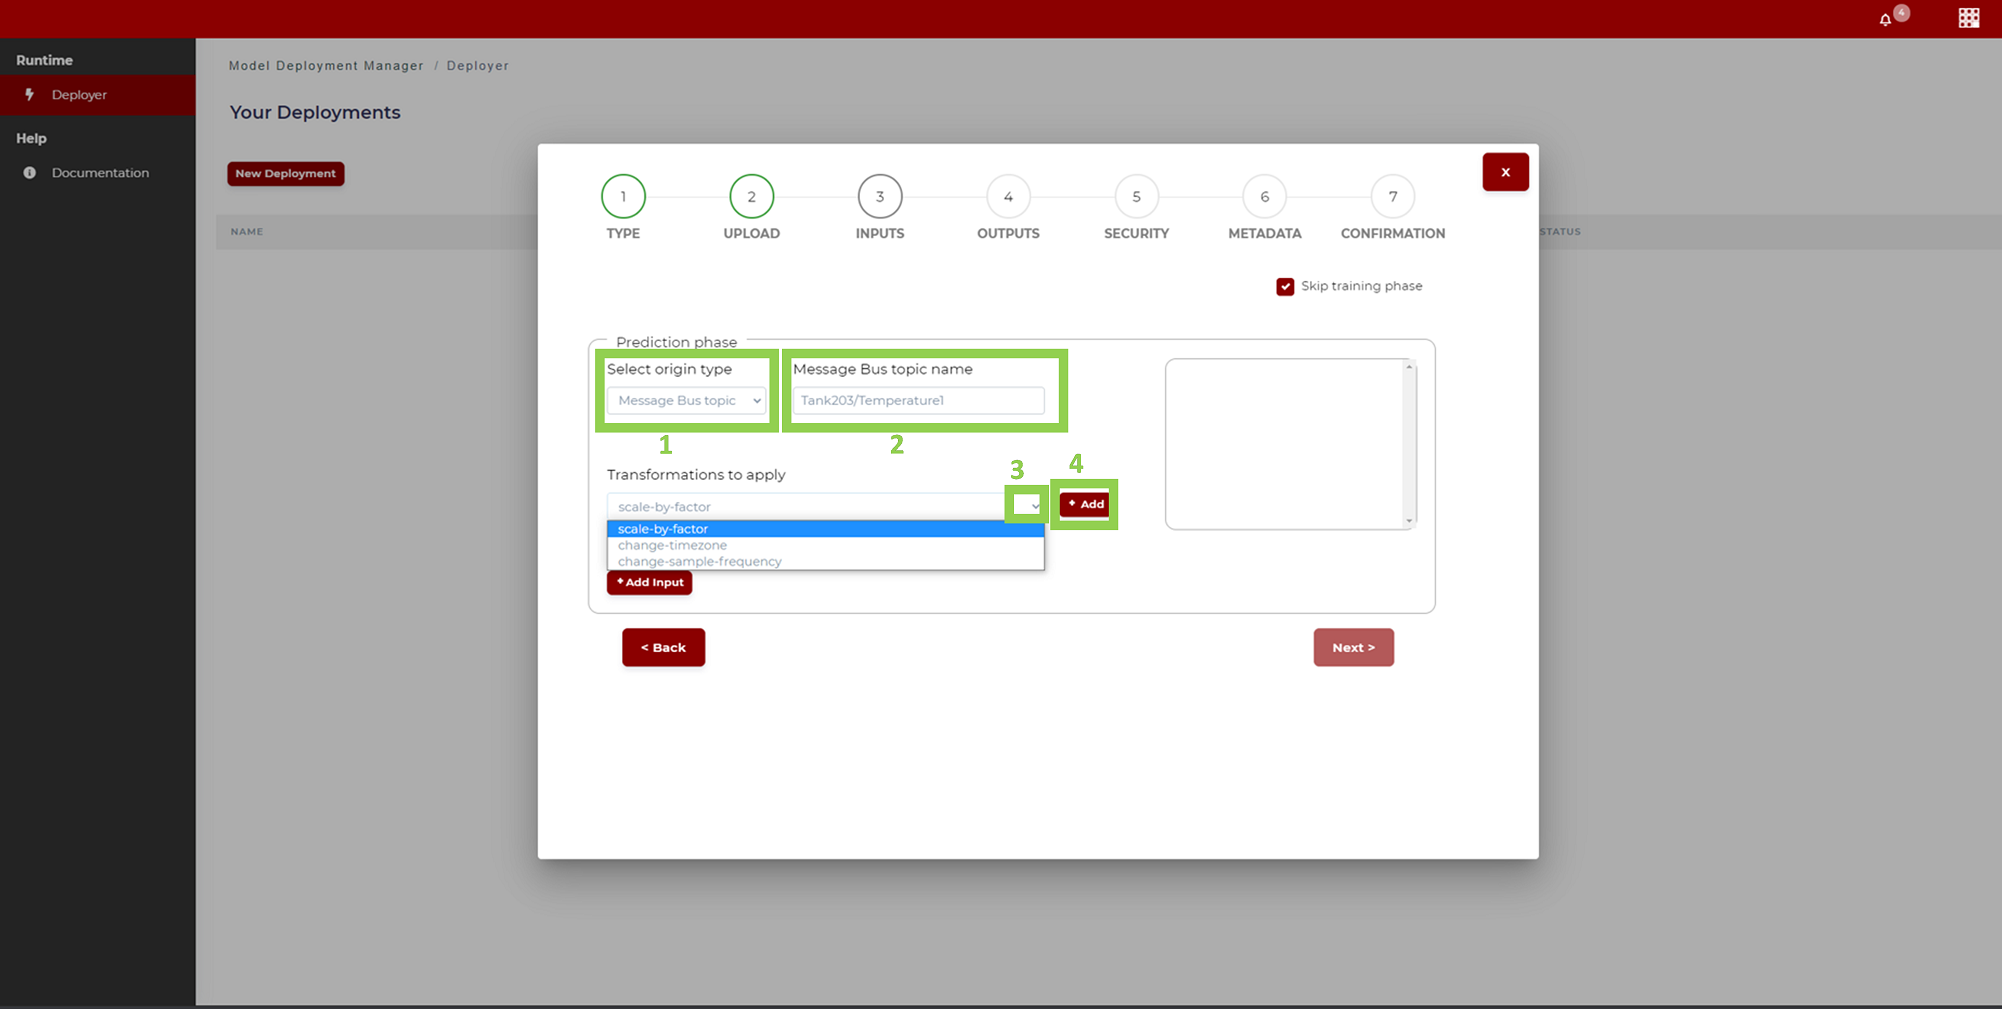
Figure 19. Model Deployment Manager – Input Signal Specification
As a final step, the complete .zip package is passed by the Model Deployment Manager to the AI Analytics Runtime that will use it to wrap the model in a proper container, deploy it, and interface it with configured input and output data services; in particular, results of the prediction can be consumed by some other platform components, for example Monitoring and Alerting to trigger an alarm when a certain threshold for a quality predicted value is overcome.
To summarise, the complete workflow of preparation of a trained model, configuration and deployment is described in the following schema.
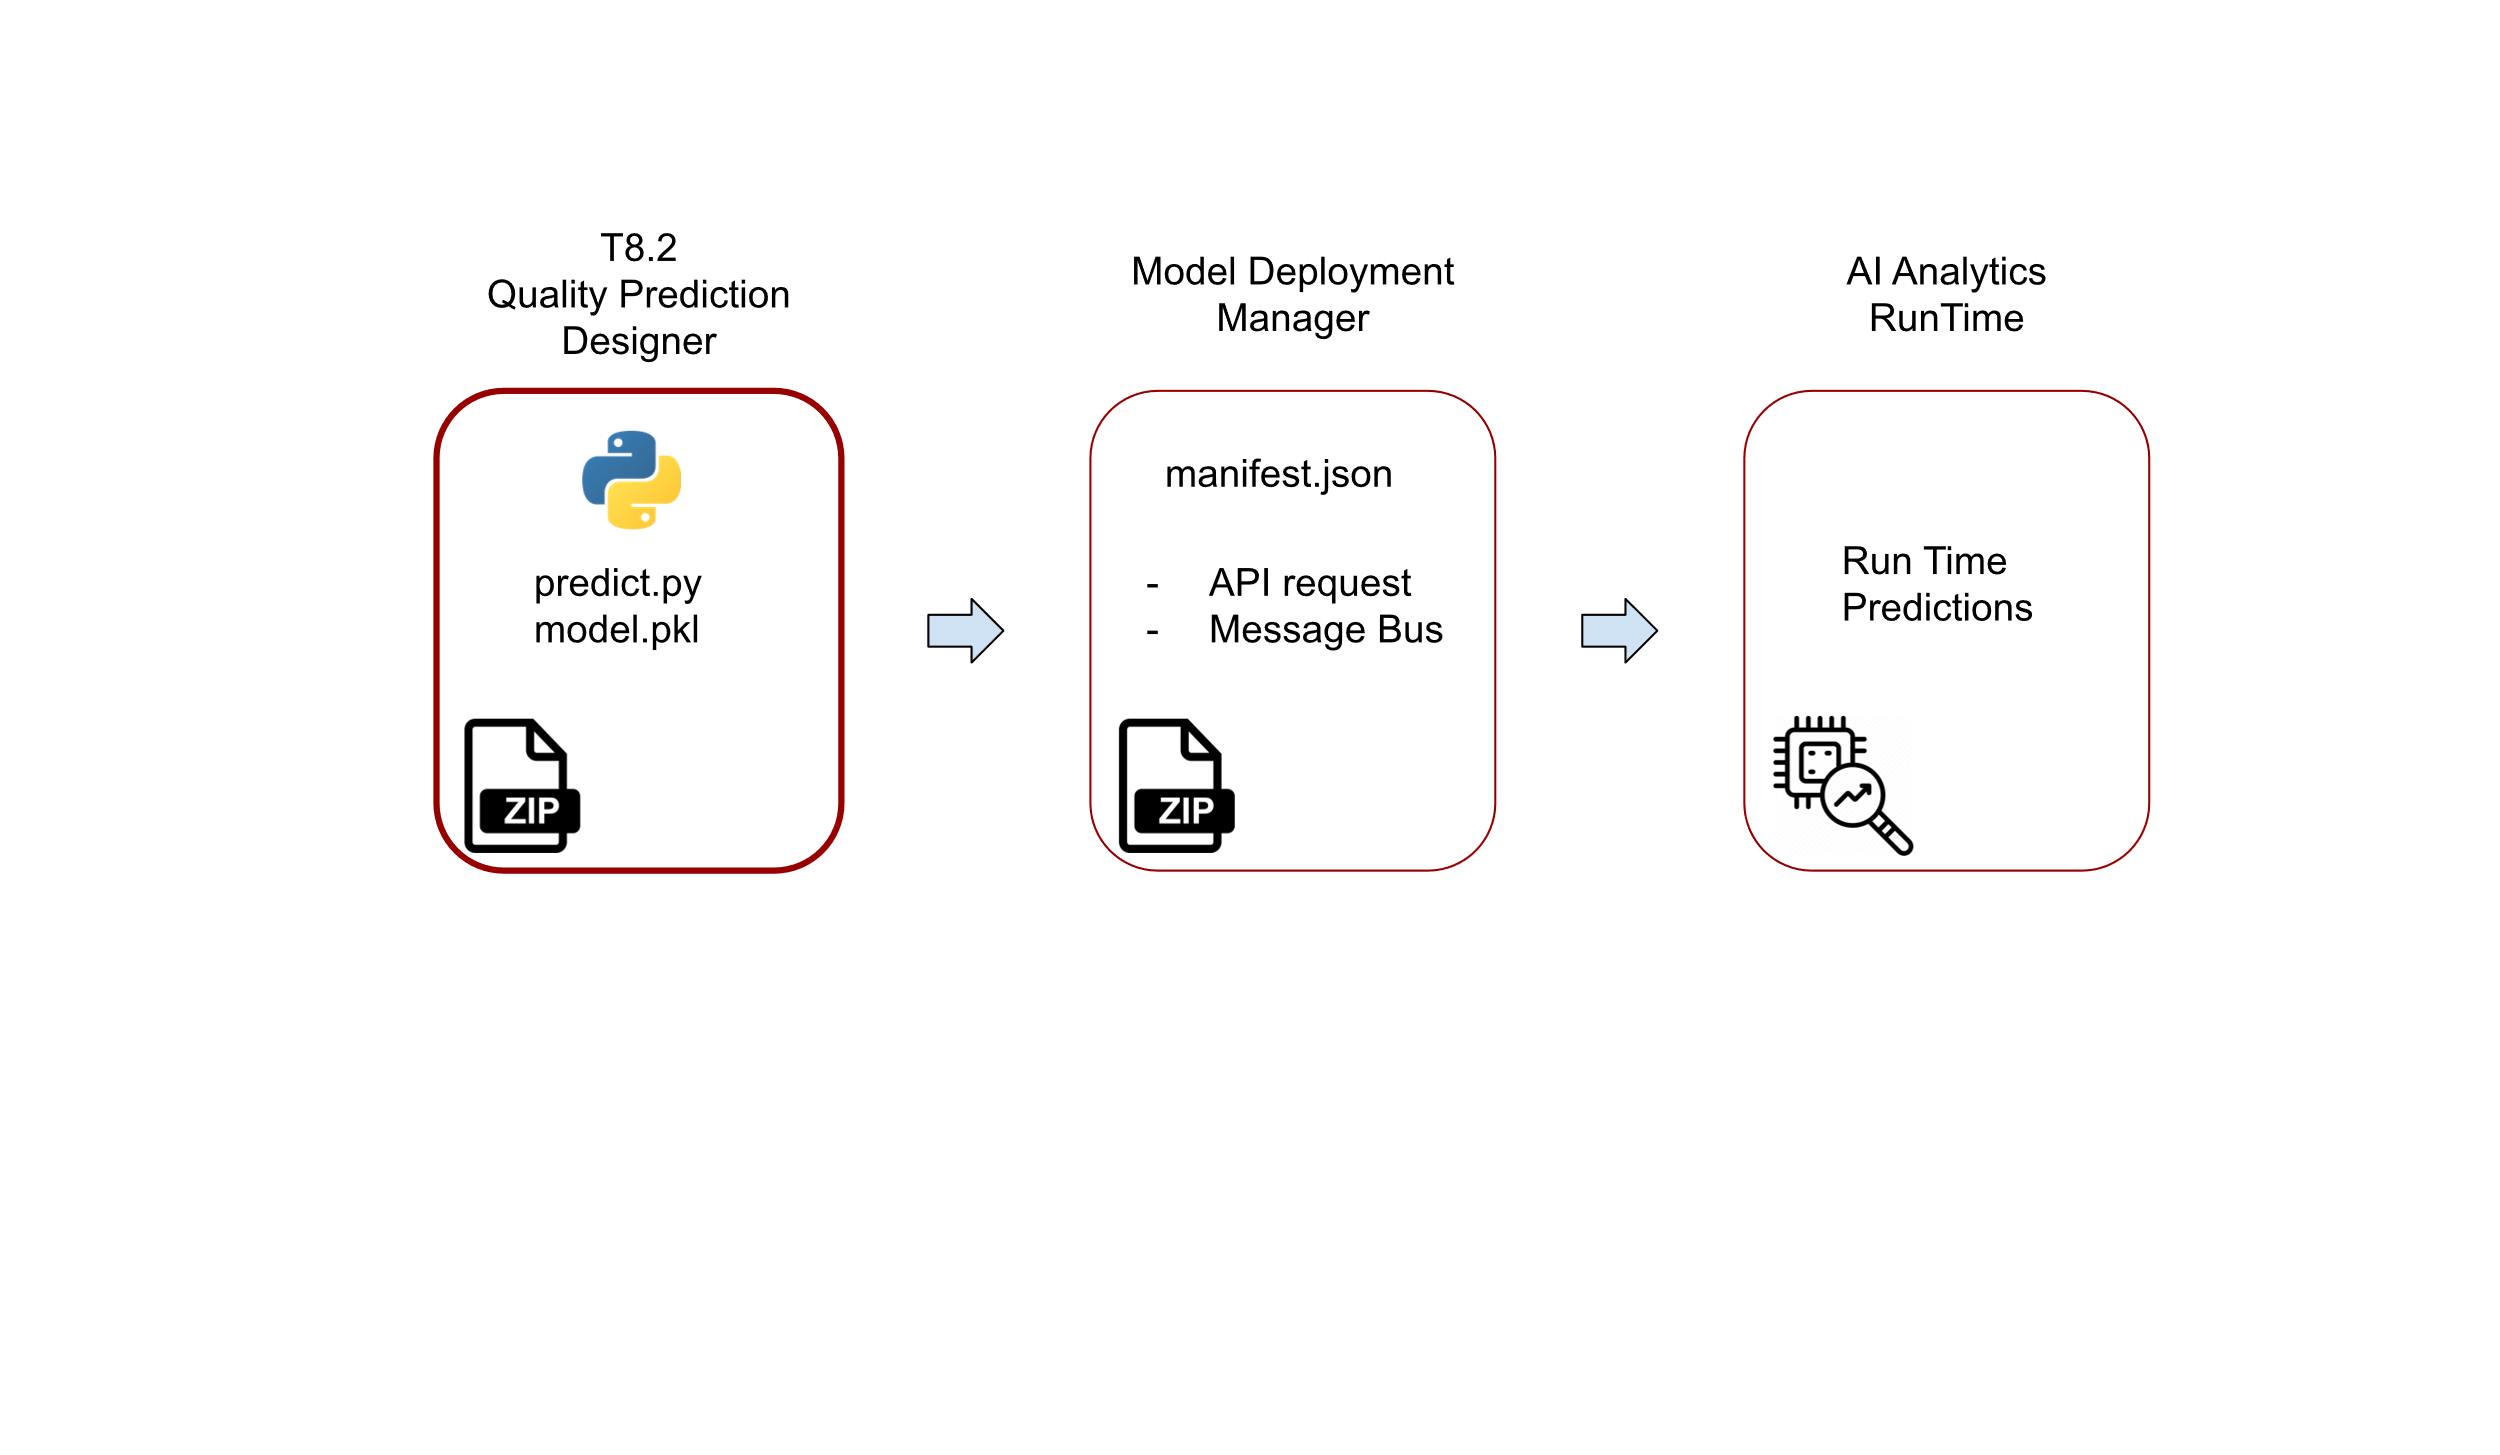
Figure 20. The schema for the preparation and deployment of quality predictors