Data Acquisition
General Description
As a prerequisite for data access, exchange, and analytics within ZDMP, the Data Acquisition component implements a framework for the handling of data from IoT sensors and other sources. It allows the connection to different kind of data sources: IIoT physical devices such as industrial automation devices (PLCs, smart sensors, RFID readers, etc), ERP systems, SCADA/MES systems/data, and existing databases. It provides a collection of functionalities among which functionalities to collect data from and to send commands to such systems.
The Data Acquisition component, in the context of ZDMP, contains gateways to various data sources (physical devices and other sources of data). It provides a flexible and modular approach to interact with the data sources through their specific interfaces and communication protocols, hiding the complexity of communicating with a wide range of sources by providing a common interface to the rest of the ZDMP system. In this sense, data sources are treated as software black boxes where implementers are free to make implementation decisions, if they provide the interfaces required by ZDMP components.
| Resource | Location |
|---|---|
| Source Code | Link |
| X Open API Spec | Link |
| Video | Link |
| Further Guidance | |
| Related Datasets | None |
| Additional Links | Cloud Cumulocity instance made available to ZDMP |
Screenshots
Component Author(s)
| Company Name | ZDMP Acronym | Website | Logo |
|---|---|---|---|
| algoWatt S.p.A. | ALGO | www.algowatt.com |  |
| Software AG | SAG | www.softwareag.com |  |
| ITI | ITI | www.iti.es |  |
Commercial Information
| Resource | Location |
|---|---|
| IPR Link | |
| Marketplace Link | https://marketplace-zdmp.platform.zdmp.eu/642c3e55a52ef |
Architecture Diagram
The following diagram shows the position of this component in the ZDMP architecture
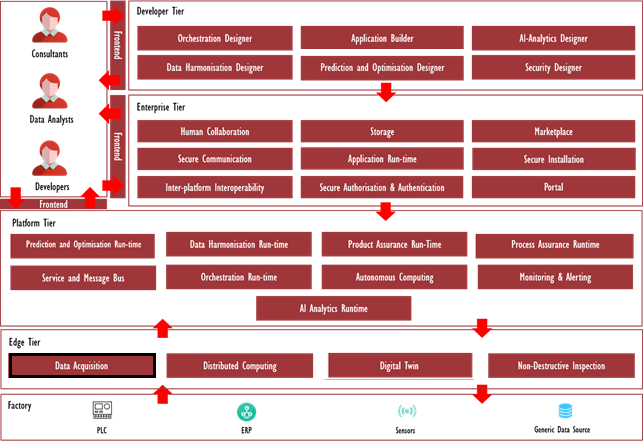
Figure 1 High level Architecture Position
Benefits
Provide functionality to manage data sources and bring data into the ZMDP system through several channels (IoT component REST endpoints, Message Bus topics, etc)
Exploit performances and reliability of enterprise level underlying IoT engine implementation (Cumulocity) while providing decoupling through a generic REST interface avoiding future vendor lock-in.
Provide an easy-to-use graphical interface for the development of data source connectors (through the Open Source NodeRed software) which requires minimal to no code writing.
Features
This component offers the following features:
Data Source (devices) Registration and Connection
Data Source Management and Monitoring
Synchronous Data Acquisition
Asynchronous Data Acquisition
Data Sources Registration and Connection
Devices and other IoT Data sources must be registered in the system as sources of information and/or receivers of actuation commands in order to allow the ZDMP platform to interact with the physical world, so that zApps could receive, query, and possibly send commands to data sources. Specific sensors associated with a given device are registered together the data source. The registration of data sources implies the specification of a set of configuration parameters and the usage of installed adapters. Registering a data source implies indicating the type of driver/protocol the data source is using (that should have been previously installed), register the set of sensors or other IIoT items a data source uses to capture data, define for each sensor or other IIoT items the supported modes (synchronous, asynchronous), and / or if the data source can be controlled.
With this goal, each class of device is represented by a so-called “Adapter”, a software module that supports the communication through specific open or closed protocols. The operation of registration and configuration of a data source is performed only by users with IT manager/administrator role inside a specific company.
Data Sources Management and Monitoring
After registering and configuring a data source within the system, a set of administration functions allows the management of the set of registered data sources. This includes functions to browse the list of registered data sources, view the status of the data sources, and view or change configuration information associated with these.
The user of specific modules in the ZDMP platform can acknowledge the source of information that could provide data to specific zApps, filter the configured list by several criteria such as name or type, assess the status of the data sources, etc.
Information such as the connection (online/offline) status of a data source is made available, as its service status (indicating that no critical, unresolved alarm present for the device), together with more detailed information such as the timestamp of the last request from the device to the server, or if any alarms at the level of individual devices and across all devices have been raised. All this helps identify and solve potential problems with the registered devices.
Since in a given organizations a large number of devices or sensors can be present at any given moment, functions to organize the set of registered data sources are provided. This includes defining data source groups and associating data sources to them according to particular business criteria. A data source can be located in multiple groups, and groups themselves can be organized in a hierarchy of subgroups.
How to use Administration APIs.
Data Acquisition Administration services can be reached from the API Gateway: /gateway/T5.1-Data%20acquisition_Admin/v0/.
It is possible to perform the following REST calls:
Data source registration - Method POST - Registration of a data source in the IoT Component.
/registerDevice?externalId=<EXTERNALID>&name=<NAME>
Data source information - Method GET - Returns all the information of a data source.
/deviceInfo?externalId=<EXTERNALID>
Data source deletion - Method DELETE - Delete a data source from the IoT Component.
/deleteDevice?externalId=<EXTERNALID>
Data source renaming - Method PUT - Rename a data source in the IoT Component.
/renameDevice?externalId=<EXTERNALID>&newName=<NEWNAME>
Get all data sources - Method GET - Returns a list of all data sources in the IoT Component.
/getAllDevices
Filter data sources by name - Method GET - Returns a list of data sources that contain the <NAME> string in their name.
/filterDevicesByName?name=<NAME>
Sort data sources by param - Method GET - Returns a list of data sources in the IoT Component sorted by <PARAM> parameter.
/sortDevicesByParam?param=<PARAM>
The params currently supported by the IoT Component are the following:
- Self
- SelfDecoded
- Type
- Name
- Owner
- CreationTime
- LastUpdate
- CreationDateTime
- LastUpdateDateTime
Synchronous Data Acquisition
A range of functionality is provided regarding the different mechanisms to read from the data sources (ie their sensors). The Data Acquisition component can implement synchronous and asynchronous read methods through its Data Source Adapter subcomponents, respectively sending data to the zApps or other ZDMP assets through a push mechanism or to the Services and Message Bus Component through a pub/sub mechanism.
In the synchronous case, the Data Acquisition component includes API endpoints to zApps, or other component interact with it, namely by reading device measurements or other device data via direct synchronous calls (REST interface) to the Data Acquisition component, or relying on some kind of polling process configuration, where queries are periodically sent to data sources which do not have a push-based mechanism.
How to use Synchronous APIs.
Data Acquisition Synchronous services can be reached from the API Gateway: /gateway/T5.1-Data%20acquisition_Synch/v0/.
It is possible to perform the following REST calls:
Get measurements - Method GET - Returns a list of all measurements of a data source.
/getMeasurements?externalId=<EXTERNALID>
This REST call could have a huge response, it is advisable to filter the measurements with subsequent calls.
Get measurements by date - Method GET - Returns a list of all measurements of a data source in a given time interval.
/getMeasurementsByDate?externalId=<EXTERNALID>&from=<DATEFROM>&to=<DATETO>
These dates must be in the format: “yyyy-mm-dd hh:mm:ss”
You can further filter this list by type of measure by specifying the fragment as parameter:
/getMeasurementsByDate?externalId=<EXTERNALID>&from=<DATEFROM>&to=<DATETO>&fragment=<FRAGMENT>
Get the number of pages of a measurements list - Method GET - In case of large numbers of measures it is possible to make a request to divide the list of measures into subsets (pages of 2000 values maximum). First of all, you have to get the number of pages.
/getPages?externalId=<EXTERNALID>&from=<DATEFROM>&to=<DATETO>
You can further filter this list by type of measure by specifying the fragment as parameter:
/getPages?externalId=<EXTERNALID>&from=<DATEFROM>&to=<DATETO>&fragment=<FRAGMENT>
Then you can perform this request to get the n page of the measurement list for the same time interval - Method GET.
/getMeasurementsByDateAndPage?externalId=<EXTERNALID>&from=<DATEFROM>&to=<DATETO>&page=<N>
You can further filter this list by type of measure by specifying the fragment as parameter:
/ getMeasurementsByDateAndPage?externalId=<EXTERNALID>&from=<DATEFROM>&to=<DATETO>&page=<N>&fragment=<FRAGMENT>
Send measurements - Method POST - Send a measurement to a data source. The request must include the fragment and the unit of measure to identify the type of the measurement.
/sendMeasurement?externalId=<EXTERNALID>&fragment=<FRAGMENT>&value=<VALUE>&unit=<UNIT>
The fragments currently supported by the IoT Component are the following:
- fragment=AccelerationMeasurement; unit=m/s2.
- fragment=BarometerMeasurement; unit=mbar.
- fragment=CurrentMeasurement; unit=A.
- fragment=DistanceMeasurement; unit=m.
- fragment=HumidityMeasurement; unit=%RH.
- fragment=LightMeasurement; unit=lux.
- fragment=MoistureMeasurement; unit=%.
- fragment=PowerMeasurement; unit=W.
- fragment=SpeedMeasurement; unit=m/s.
- fragment=TemperatureMeasurement; unit=C.
- fragment=VoltageMeasurement; unit=V.
Send custom measurements - Method POST - Send a measurement to a data source. The request does not have to contain a fragment supported by the IoT Component, but you can create a customized one.
/sendCustomMeasurement?externalId=<EXTERNALID>&fragment=<CUSTOMFRAGMENT>.
You can define a fragment with the name you want, and the measurement values must be specified in a JSON format in the request body, for example:
{
“MyCustomMeasurement”:
{
“a”:123,
“b”:456.27,
“c”: “test string”
}
}
Get all alarms - Method GET - Returns a list of all the alarms in the IoT Component.
/getAllAlarms
Get device alarms - Method GET - Returns a list of all the alarms of a data source.
/getDeviceAlarms?externalId=<EXTERNALID>
Get alarm by ID - Method GET - Returns the info of the alarm with the <ALARMID> ID
/getAlarmById?alarmId=<ALARMID>
Send alarm - Method POST - Send an alarm to a data source.
/sendAlarm?externalId=<EXTERNALID>&type=<TYPE>&severity=<SEVERITY>&text=<TEXT>
The severities currently supported by the IoT Component are the following: WARNING, MINOR, MAJOR, CRITICAL.
Get all events - Method GET - Returns a list of all the events in the IoT Component.
/getAllEvents
Get device events - Method GET - Returns a list of all the events of a data source.
/getDeviceEvents?externalId=<EXTERNALID>
Get event by ID - Method GET - Returns the info of the event with the <EVENTID> ID
/getEventById?eventId=<EVENTID>
Send event - Method POST - Send an event to a data source.
/sendEvent?externalId=<EXTERNALID>&type=<TYPE>&text=<TEXT>
Asynchronous Data Acquisition
Though more direct, the mechanism of synchronous data acquisition presents several drawbacks, such as blocking and latency problems, principally when large volumes of data are being generated by the devices. A second, more efficient mechanism for data acquisition is to provide data asynchronously to zApps or other ZDMP platform modules that subscribed for it.
The ZDMP Platform provides a Service and Message bus as one of the main communication layers for the ZDMP components. The Message Bus uses a publish/subscribe messaging concept to enable zApps, other platform components, and external platforms to publish information to certain topics and to listen for specific events. The chosen technology for the implementation of the ZDMP Service and Message Bus is the RabbitMQ message bus.
In the context of ZDMP Data Acquisition component, a sub-module provides connection between the backend data collection functionality and the platform’s Service and Message bus, by subscribing to data incoming from the registered devices and transferring this data to a dedicated topic in the bus. Data is then transferred asynchronously to interested zApps and other ZDMP components through the bus publish/subscribe mechanism.
How to use Asynchronous APIs.
Data Acquisition Asynchronous services can be reached from the API Gateway: /gateway/T5.1-Data%20acquisition_Asynch/v0/.
It is possible to perform the following REST calls:
Subscribe to a data source (standard topic structure) - Method POST - Every incoming measurement, alarm or event will be forwarded to the main topic of the data source.
/subscribe?externalId=<EXTERNALID>&topicType=standard
Subscribe to a data source (multi topic structure) - Method POST - Under the main topic of the datasource, a dedicated subtopic will be created for each type of measurement, alarm, or event.
/subscribe?externalId=<EXTERNALID> &topicType=multi
Unsubscribe from a data source (standard topic structure) - Method DELETE - Stop receiving messages on the main topic of the data source.
/unsubscribe?externalId=<EXTERNALID> &topicType=standard
Unsubscribe from a data source (multi topic structure) - Method DELETE - Stop receiving messages on the subtopics of the data source.
/unsubscribe?externalId=<EXTERNALID> &topicType=multi
System Requirements
The REST APIs components are deployed as docker containers on the ZDMP Platform Kubernetes cluster and do not necessitate any specific additional system requirements beyond those of the platform.
Data Source Adapters, in the form of custom code dockerized components or as NodeRed scripts can be deployed on edge devices or corporate servers, in such case the requirements are respectively the ability to run docker infrastructure or the NodeRed application.
The main backend IoT engine for the current implementation of the data acquisition component is provided by the Cumulocity IoT Platform (http://www.cumulocity.com/), provided by project partner Software AG. An installation of the Cumulocity platform must be provided and accessible by the rest of the ZDMP Platform. Cumulocity can be installed both OnPremises servers and InCloud. Currently, a cloud instance of the Cumulocity platform is provided at the URL https://zdmp-da.eu-latest.cumulocity.com/.
Minimal hardware requirements for the installation of a Cumulocity instance are the following:
Disk space: 100 GB
CPU: Intel x86
Number of cores: 4
Memory 8 GB
Associated ZDMP services
Required
Optional
T6.4 Portal
How to use
Data Acquisition and IIoT functionality is made available through a set of REST API components offering access to the functionality provided by a backend IoT engine and a set of Data Acquisition adapters provided either as custom code components (eg applications written in Java or other programming languages) or through the development of NodeRed scripts accessing the above APIs.
The following figure depicts the overall general flow for acquiring data from the different data sources into the ZDMP system.
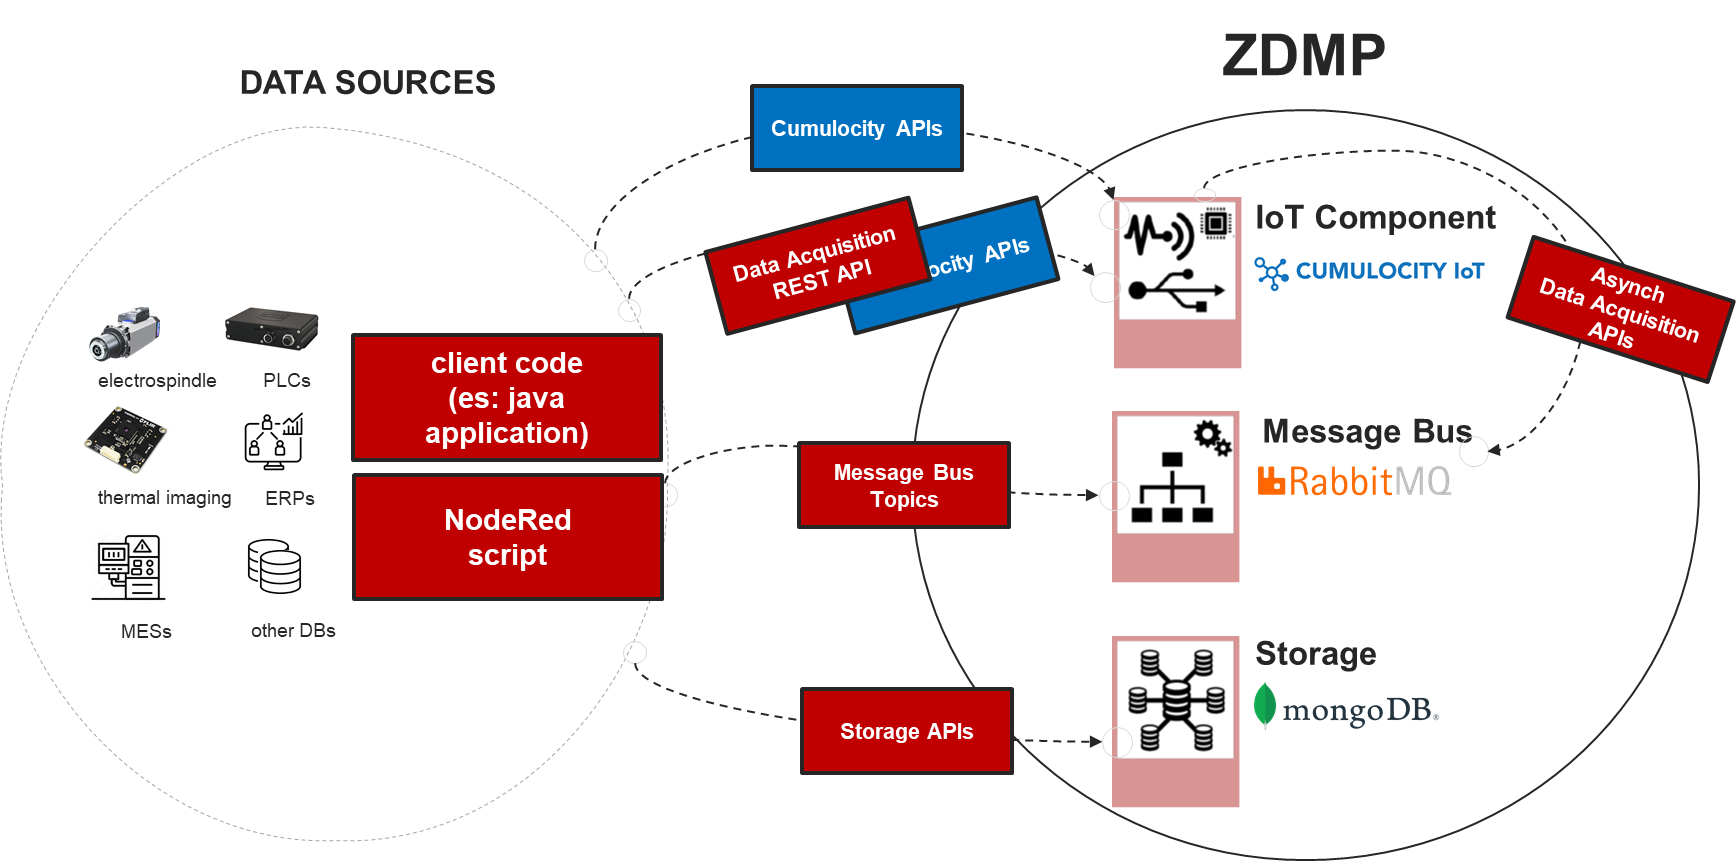
Figure 2 ZDMP Data Acquisition flow
In the current implementation, device configuration and management functionality available via Cumulocity’s ZDMP-customized native User Interface. As a stand-alone web application and with the case of a greater integration with ZDMP User Interface provided by the ZDMP Portal developed in T6.4, the possibility to develop specific User Interface modules exposing data source management functionality to end users is foreseen by the end of the development stages of the project.
The User Interface includes access to several function provided by the Data Acquisition system. The Device Management provides functionalities for managing and monitoring devices and enables a party to control and troubleshoot devices remotely. Through this application:
Register devices manually and or bulk-register devices
Browse registered devices, grouping devices into top-level groups and subgroups.
View and configure device details
Monitor and control devices, including connection quality and service status of devices
Handle alarms from devices. Remote control and troubleshoot devices.
Manage device data, retrieving and managing firmware and software for devices.
Retrieve configuration data and store and manage it in a configuration repository as configuration snapshots
Data Source registration and management functionality are available through a main Cockpit control panel provided by the customized UI. In the figure below, the main Cockpit application screen is depicted.
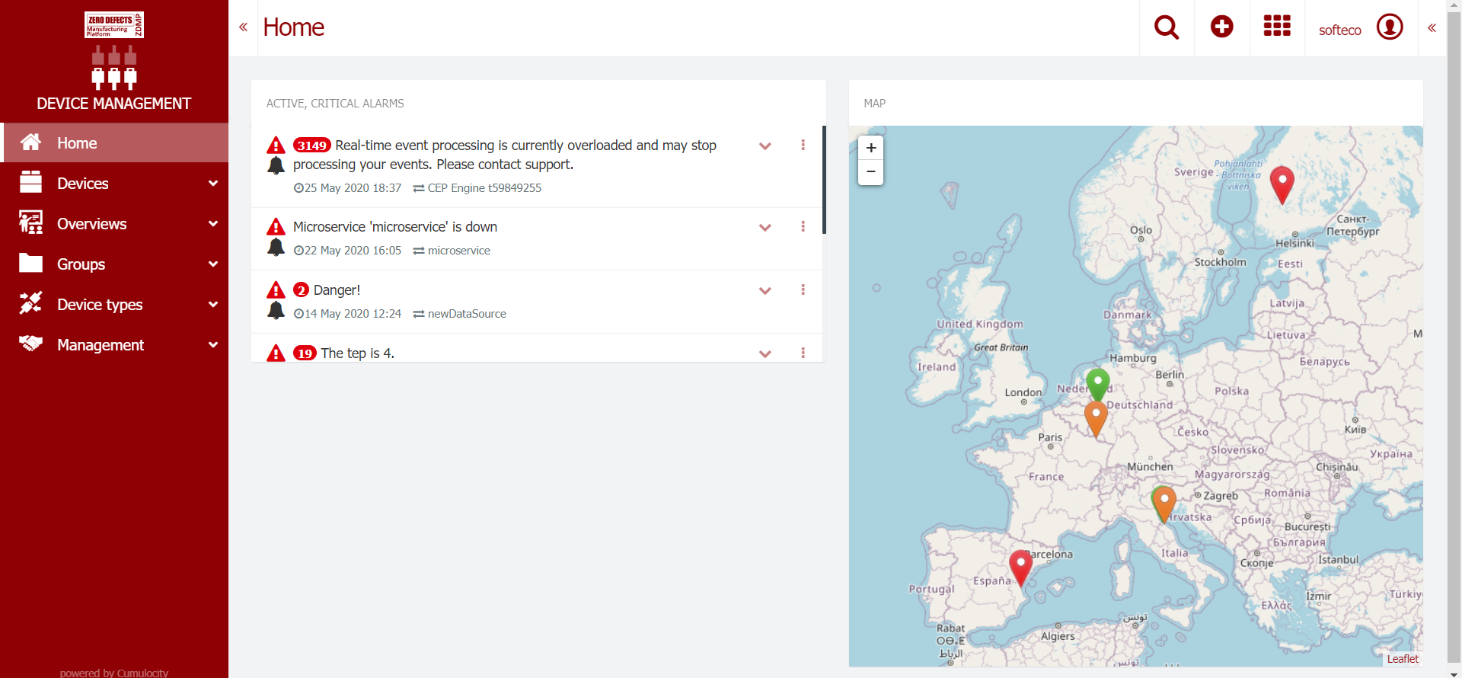
.Figure 3 Cumulocity Main CockpitFrom this screen, access to the main device management functionality is provided, as described in the following subsections. For space reason only the principal functions are illustrated in this document, while a complete usage guide for Cumulocity User Interface is not included in this document. More detailed information can be found at the address: https://cumulocity.com/guides/users-guide/getting-started/#gui-features.
Figure 3 Cumulocity Main Cockpit
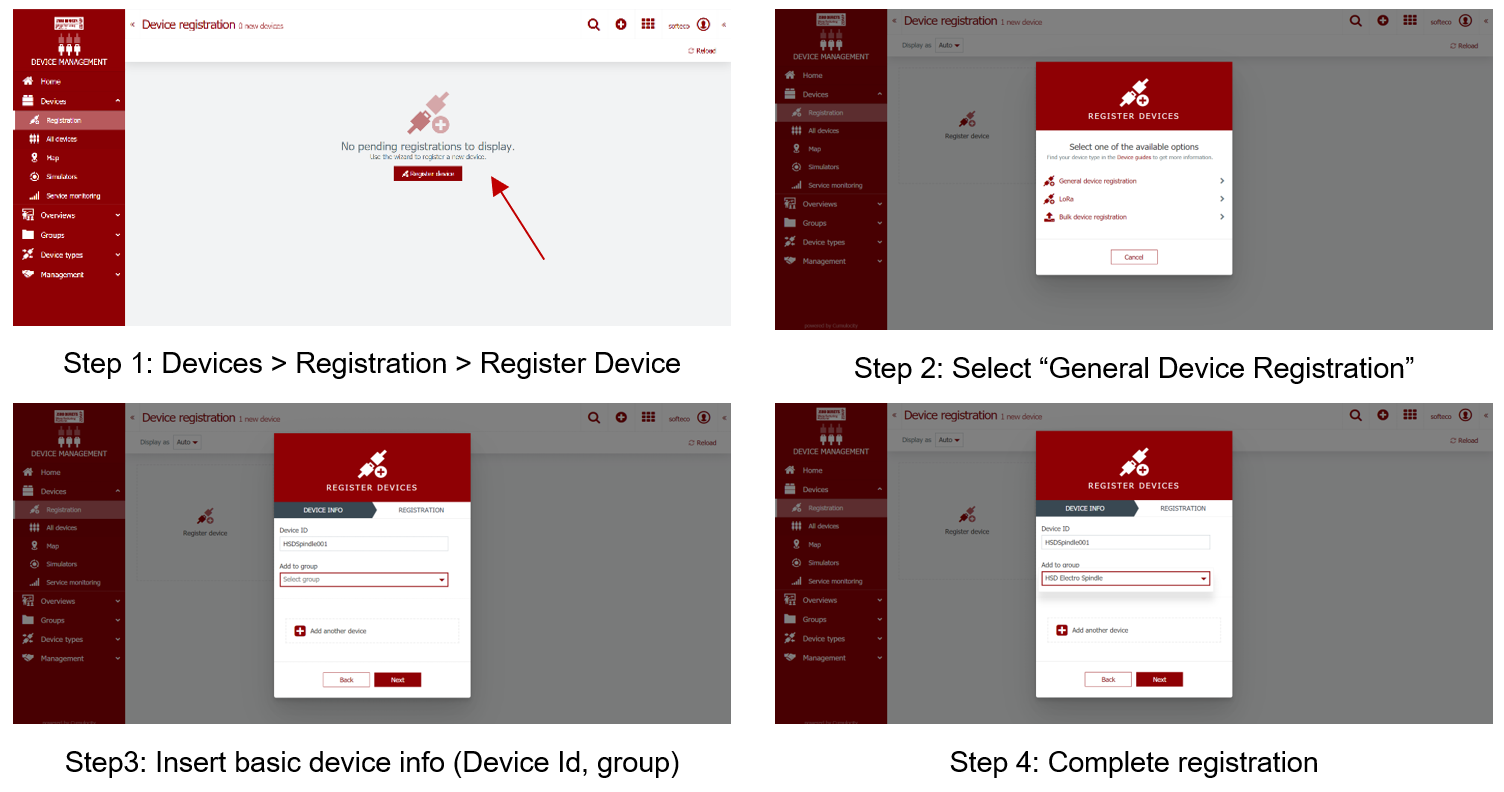
Register a new data source (device)
To register a new device with the system, from the main control panel select from the left-side menu the option:
Devices > Registration
A dialog will appear asking for basic device information (the Device ID)
| | |
| —————————————————— | |
|  | |
| |
Figure 4 Device Registration
Devices can also be registered through a bulk registration, ie the registration of a large number of devices at the same time by uploading a CSV file containing the related information. After this step, the Device registration page will show a list of all devices which are currently in the registration process, shown with a status icon representing the current registration status. The registration is complete when a device with the specified Id successfully manage to connect to the platform.
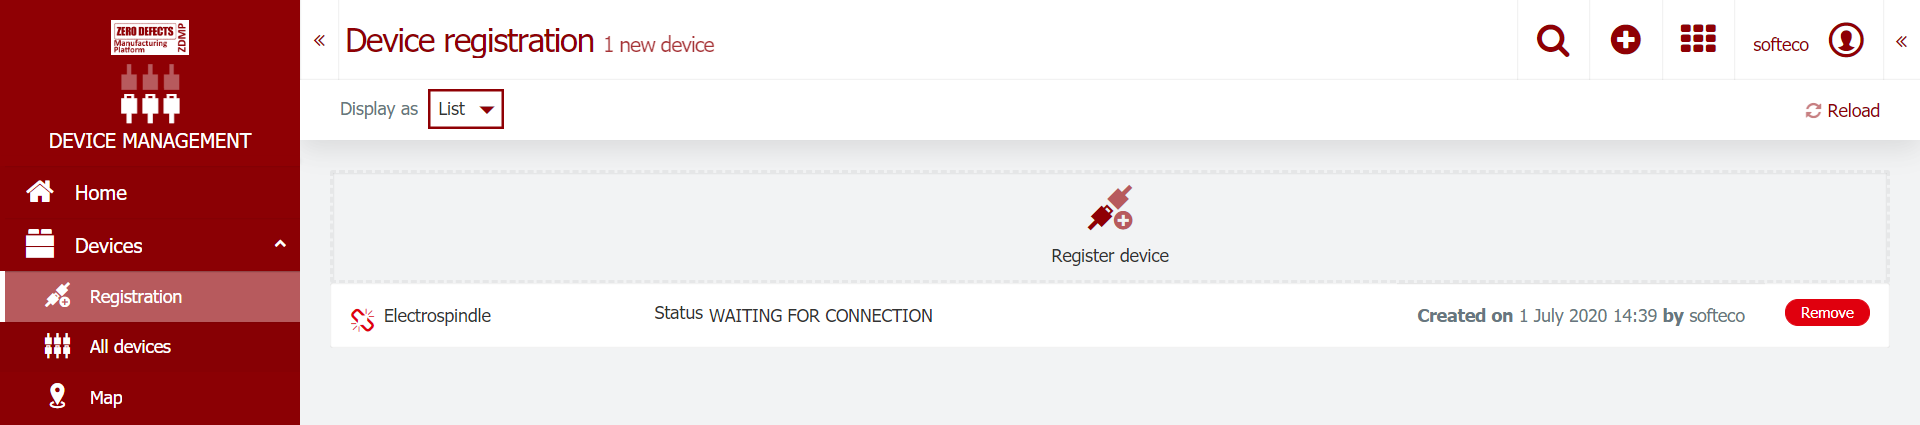
Figure 5 Device waiting for connection
Sending Data
Data is sent to the ZDMP Platform by invoking one of the REST Endpoints such as /sendMeasurements on the REST API components. The invocation of Cumulocity-native REST Endpoints, though technically valid, would tie client code to the proprietary Cumulocity implementation, for this reason it is advisable to use the REST Endpoints provided by the integration layer components. This way, an alternative (Open Source) implementation could replace in the future the backend engine without the need for the clients to change their code. The REST APIs endpoints are made available to clients (Data Source Adapters or other components in the ZDMP Platform) via their registration on the ZDMP API Gateway.
As mentioned, Data Adapters, ie the components that connect to the actual data source via their native protocols and ship this data to the ZDMP Platform, can be developed as standalone components (eg Java application) with custom code accessing the mentioned REST API endpoints, or can be developed as NodeRed scripts.
NodeRed is an Open Source development tool for visual programming developed originally by IBM for wiring together hardware devices, APIs and online services as part of the Internet of Things, which provides a web browser-based graphical user interface, allowing the development of Adapters with the requirement of minimal code writing skills. NodeRed can run on low-cost hardware (such as Raspberry PI) as well as in the cloud, making it suitable for deployment either on edge devices or on the main ZDMP Platform.
The following figure depicts one example script in NodeRed representing a simple flow from the device to the REST endpoints, with some processing in the middle.
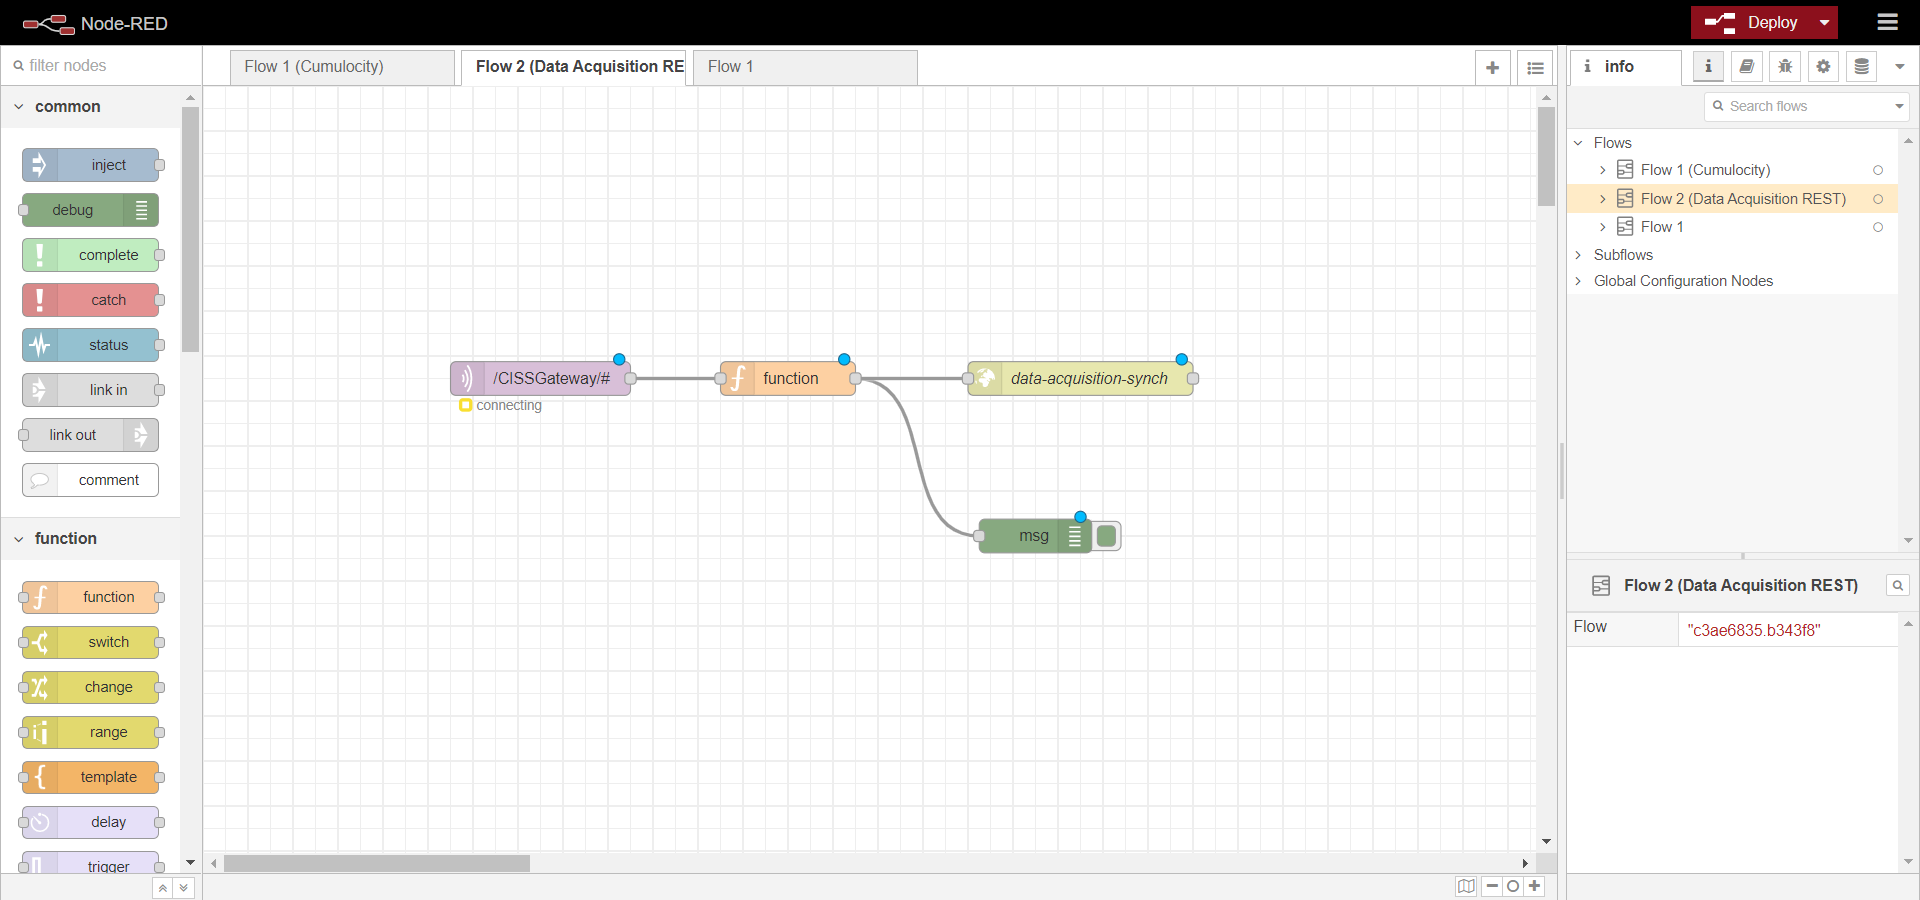
Figure 6 NodeRed example flow
View and manage data sources
From the left-side menu in the main Cockpit application, a list of the currently registered devices can be shown by the option:
Devices > All devices
This shows the following screen:
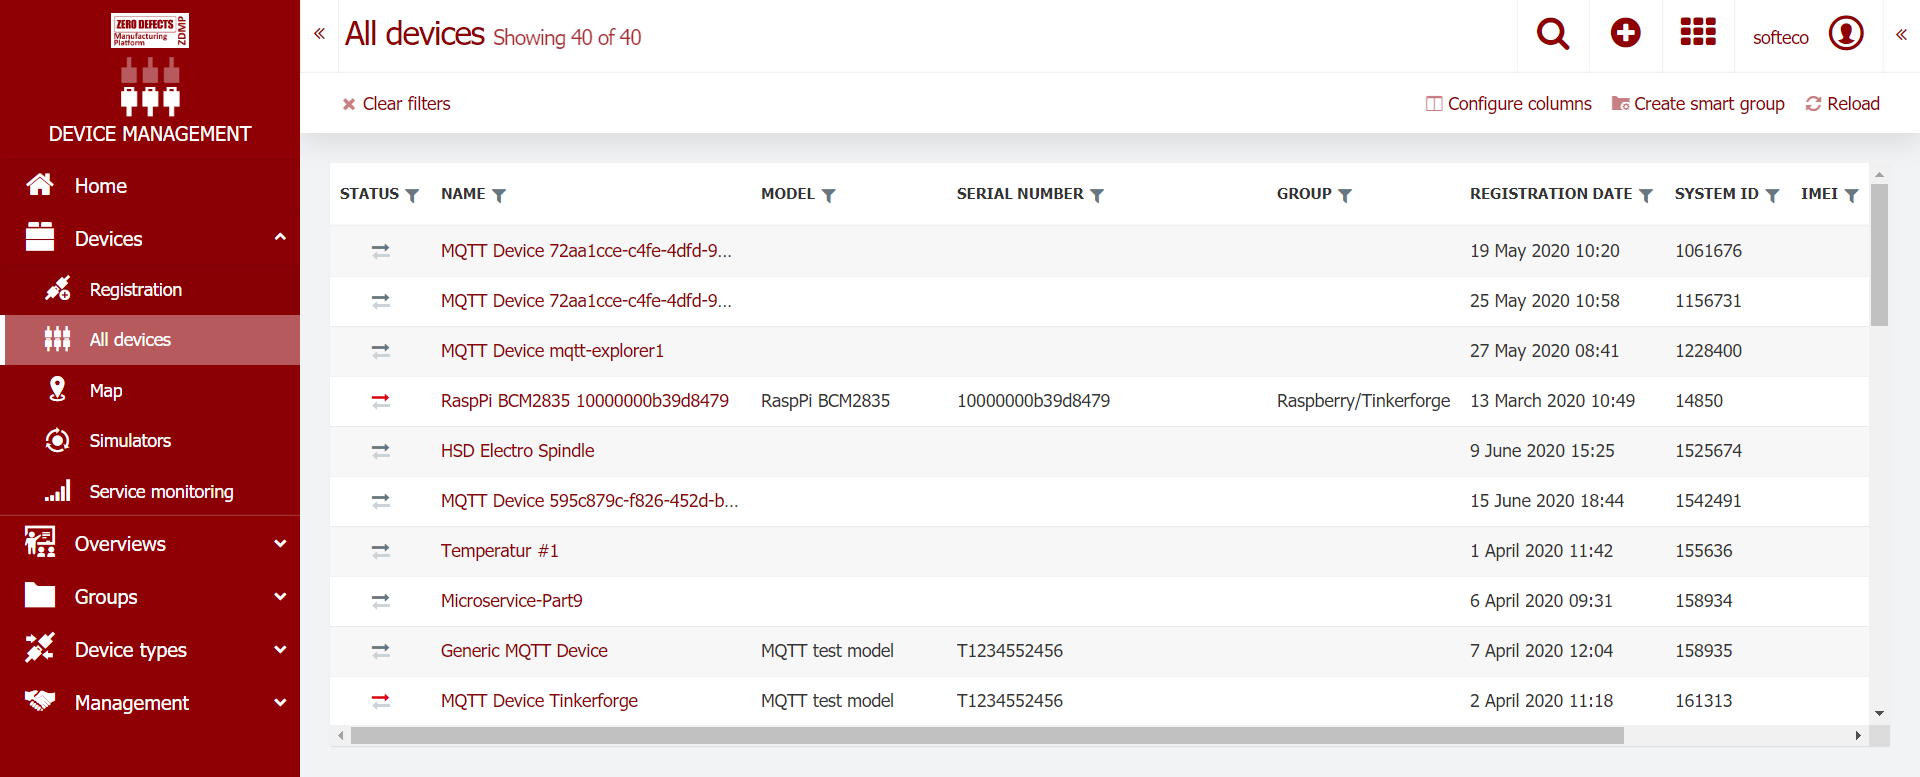
Figure 7 List of registered devices
By clicking on the device name, it is possible to access the device management control panel, where registration information, device data, status, alarms, or event information is displayed.
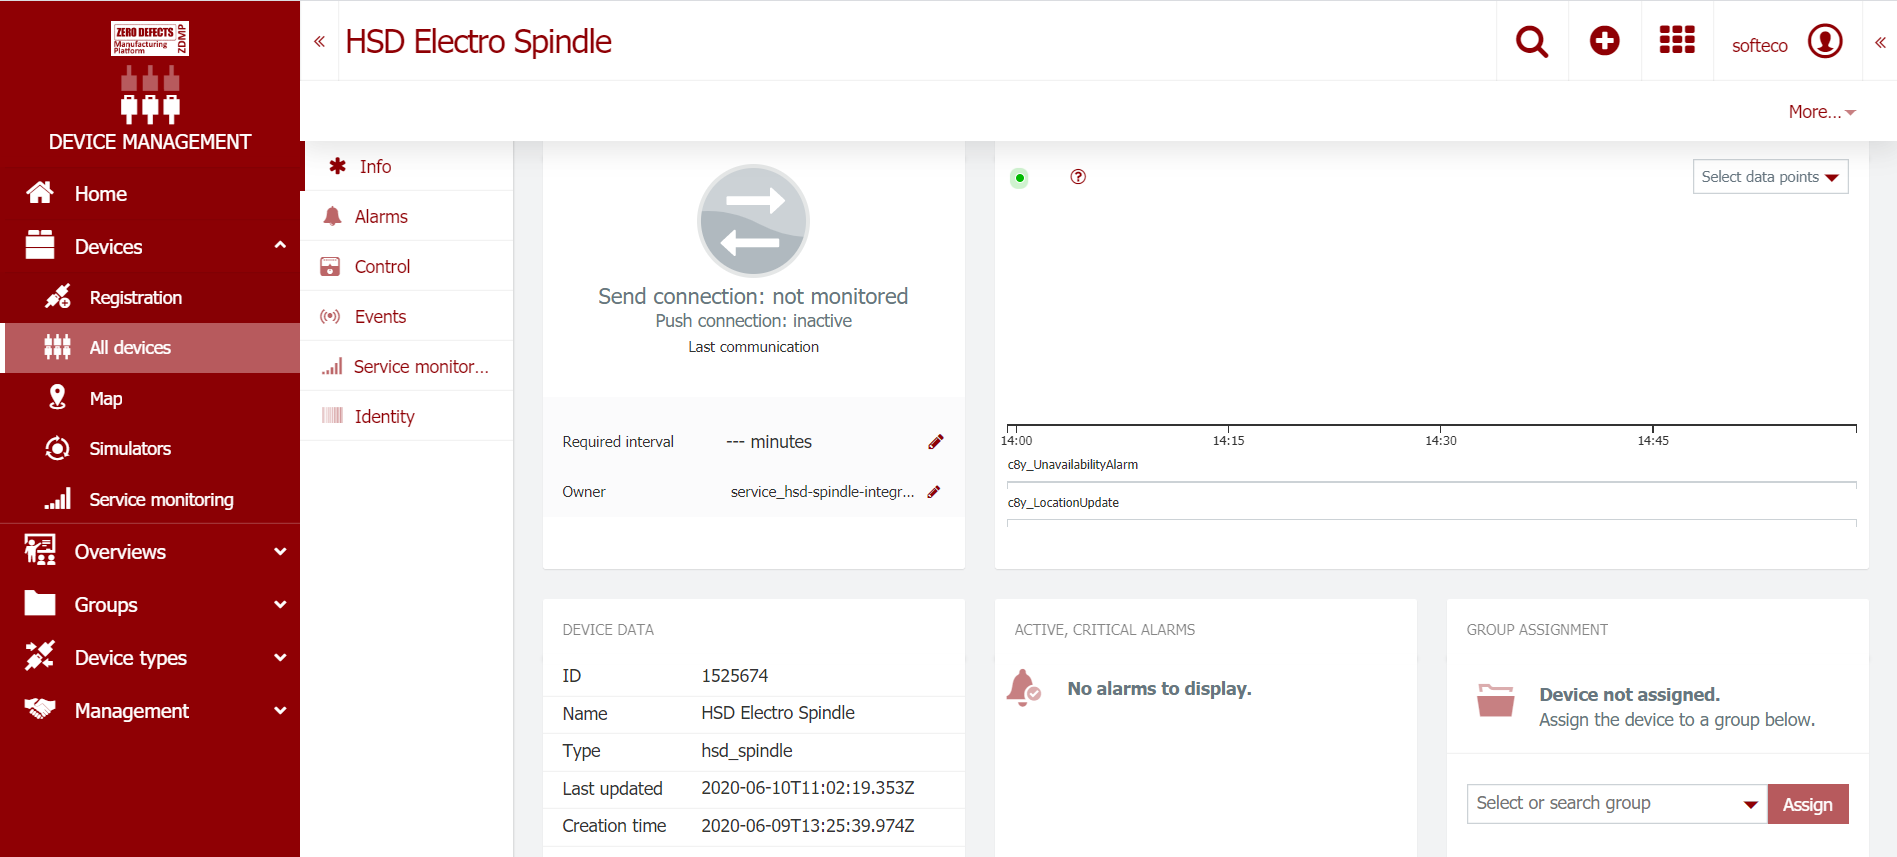
Figure 8 Device management panel
Other data source management functionality is accessible through the left-side menu item:
Groups > …
Where devices can be assembled into groups according to several business criteria.
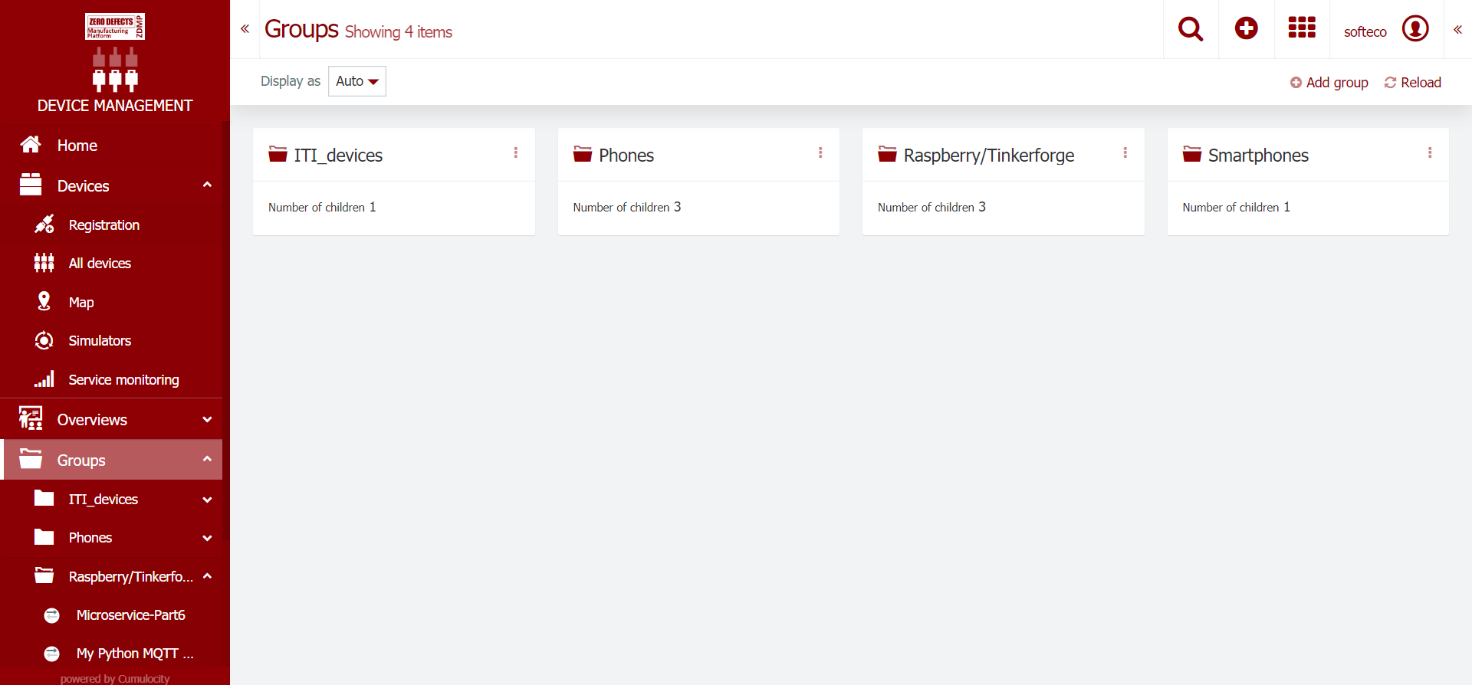
Figure 9 Group functions
Service monitoring
The status of a device connection can be monitored via the Device Management panel shown above. A required interval can be configured to define how often it is expected to hear from a given source. If, for example, the required interval is set to 60 (minutes), the device is expected at least to communicate once in an hour with the platform. The interval is either set by the device itself, based on the device’s knowledge how often it will try to send data, or it is set manually via the management interface. The device can be in one of the following statuses:
Online (data was sent within the required interval), indicated by a green arrow in the UI
Offline (data was not sent within the required interval), indicated by a red arrow
Unknown or not monitored (no interval configured), indicated by a grey arrow
When a device is detected to be offline (ie it stops sending data within required interval and top arrow changes to red colour), an unavailability alarm is created for the device: “No data received from device within required interval”.
Moreover, the device may be in “Maintenance” mode. This is a special connection status indicating that the device is currently being maintained and cannot be monitored. Whilst a device is being maintained, no alarms for that device are raised.
Besides monitoring the connection status, also the service status is monitored. Connection monitoring and service monitoring are distinct concepts in that connection monitoring only indicates if the device is communicating with the platform, whilst not indicating if it is in service or not. A device is considered to be in service while there is no critical, unresolved alarm present for the machine - eg if a machine did not have any critical alarms whatsoever during a time period, it was 100% in service. If half of the time there was some critical, unresolved alarm, the machine was 50% in service.
Service monitoring is available from the main Cockpit left-side menu, under the menu item:
Device > Service monitoring
This Service monitoring page shows the availability percentage of devices for the last 24 hours, last 7 days and last 30 days.
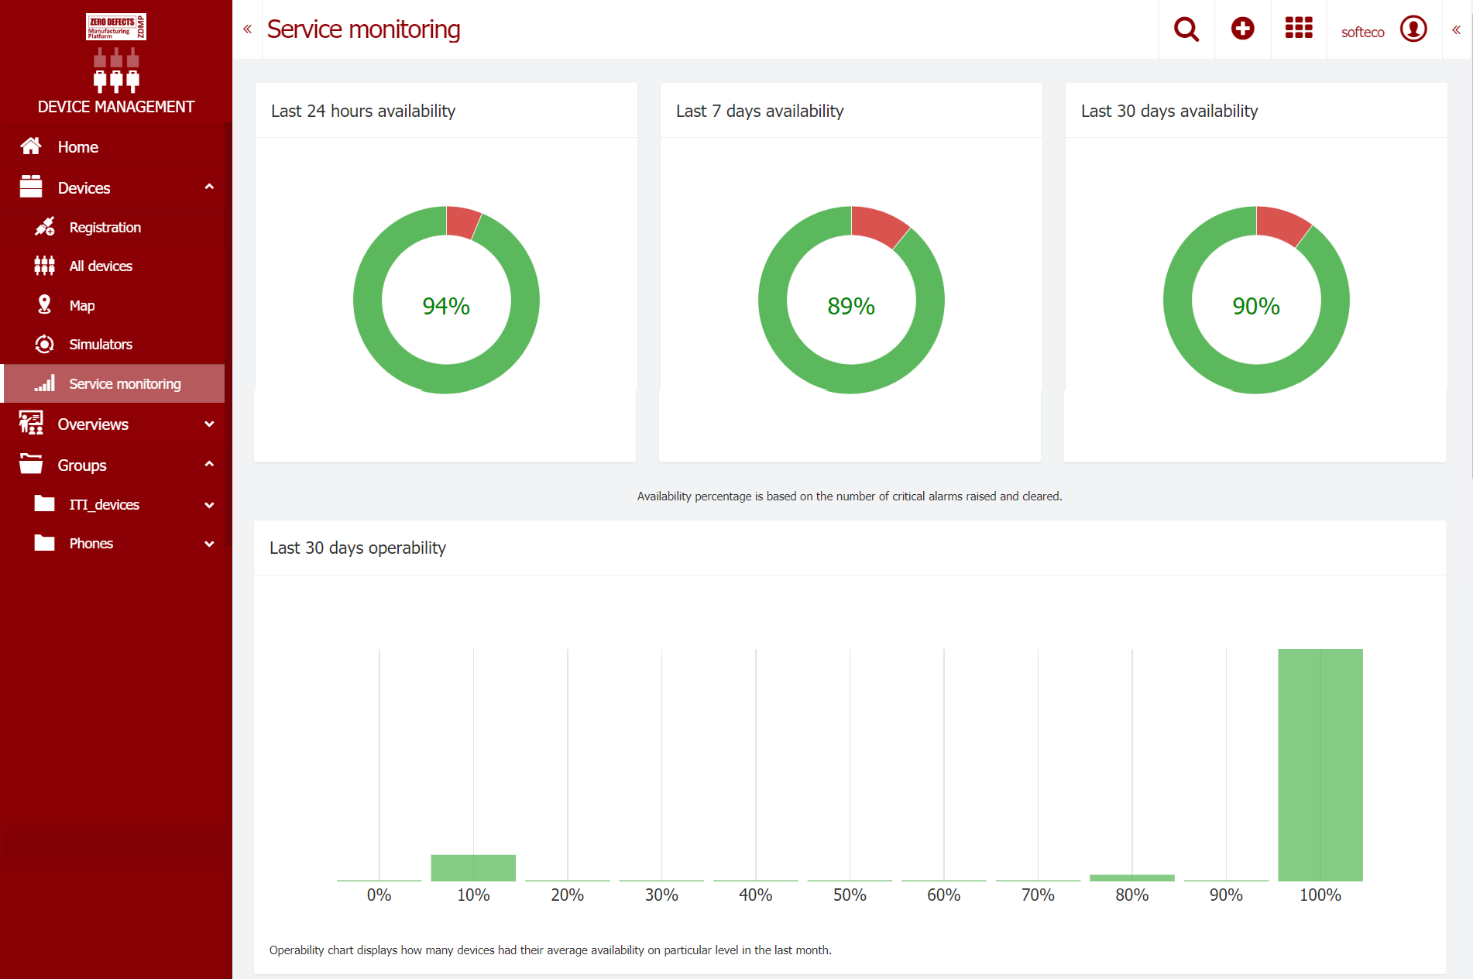
Figure 10 Service monitoring
Reading data
Once the data sources are registered as described in the previous section, and devices are connected and communicates with the platform, measurement data starts flowing and it is made available to the components of the ZDMP.
Of course, this part is not accessible directly to end users for what concerns the Data Acquisition module, while data made available in these ways from this module to zApps and other ZDMP components will be shown or will influence visualization of each application User Interface in ways that are specific of the zApp or component’s User Interface.
The REST APIs can be invoked by components in the ZDMP Platform in a way no different than any other REST interface exposed in the platform, through their registration on the ZDMP API Gateway, by using the published endpoints. The asynchronous data can be read by components by subscribing to the configured topic on the Message Bus, at the moment such topic is defined as:
“T5_1-Data-Acquisition”
in the future, different topics can be defined (for instance data source-dependent or zApps-dependent topic names) to better manage the flow of incoming data.
For debugging and monitoring purposes, though, data arriving at the Message bus can be visualized by using RabbitMQ administration interface as illustrated in the following screenshot:
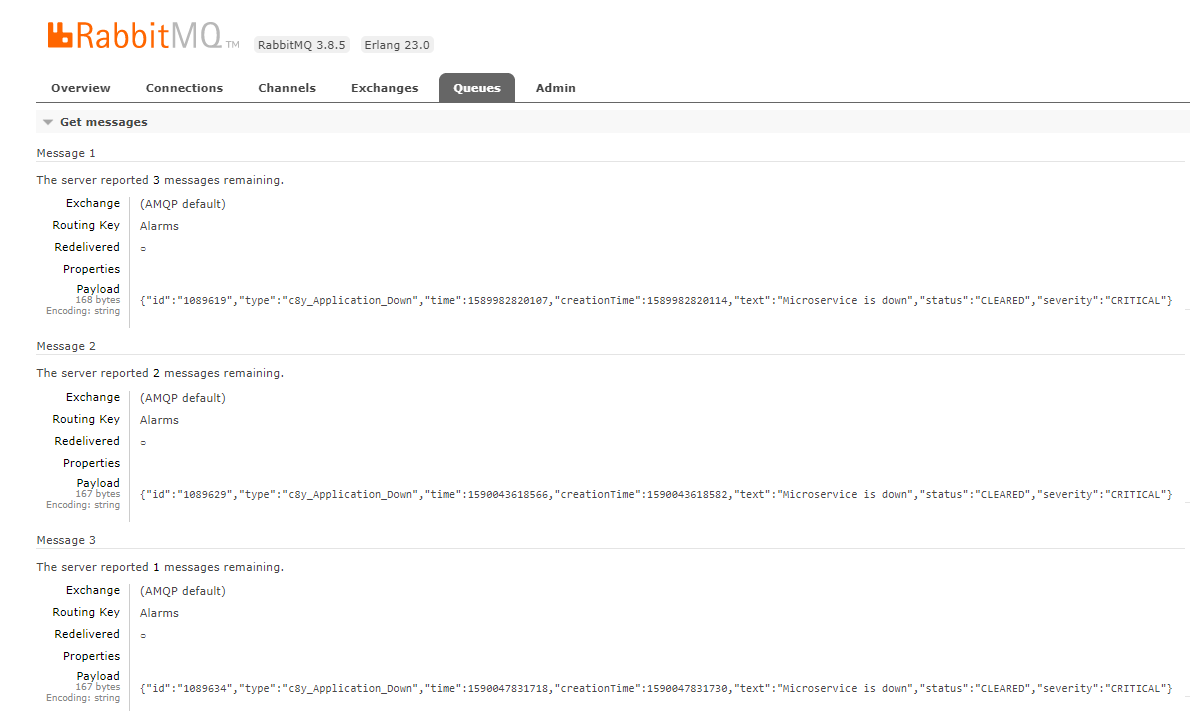
Figure 11 Incoming messages on the Message Bus
Managing Image Data
As described in the previous sections, the data ingestion functionality provided by the Data Acquisition component relies on the functionality provided by the Cumulocity IoT engine.
One limitation of this consists in the fact that Cumulocity IoT does not currently support the upload of large image data, such as large jpg or png images provided by image capture devices eg industrial cameras or similar. It only allows sending small images (60x80 pixels resolution)
In Zero Defects manufacturing, the capture and storage of image data is a much-needed functionality to manage different use cases. Machine vision systems and industrial cameras can be exploited in any number of applications, ranging from automatic monitoring of production processes, measuring, and counting products, or assessing quality by visually inspecting the manufactured goods moving at top speed with respect to their predefined characteristics.
In particular, in the ZDMP project, the need for such a functionality as arisen in several contexts: The ZDMP Component T8.3 Non-Destructive Inspection is in particular dedicated to quality analysis through images, so the ability to manage connection and data exchange with this kind of devices is of primary importance. Image data and cameras are moreover used in many of the project’s pilot Use Cases, among which UC1.2: Engine block manufacturing: Defects detection and prediction in machining operations, UC3.2 Assembly line: AI-supported optical defects detection, UC4.1 and UC4.2: Stone tiles: equipment wear detection).
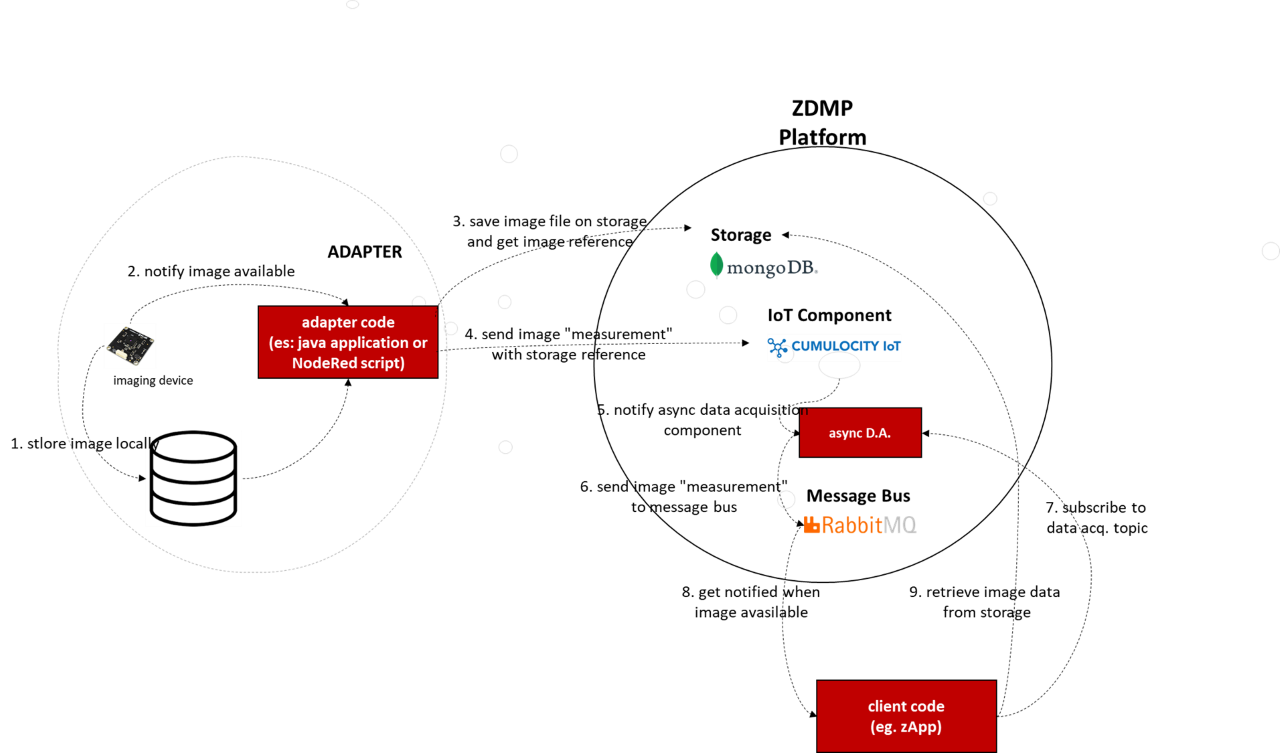
In order to integrate image data ingestion with the functionality provided by the Data Acquisition Component, this component makes use of functionality provided by other ZDMP Components, such as the Storage Component and the Message Bus component. In a first phase the image acquisition device (eg the industrial camera) acquires the image data and provides it somewhere on an edge device (for instance by storing this data on some local storage). Here, a data acquisition adapter, developed either as a client application by directly using the Data Acquisition REST endpoints in code, or visually through a Nodered flow, transfers the image data to a location on the ZDMP Storage, and keeps a reference to where this image is stored (eg an image path on a dedicated NFS folder). This reference is then stored as a string attribute of a Measurement record sent to Cumulocity using the functionality already described in the previous section 1.10.2.
At the other end of the workflow, a client accessing the image data can for instance get these “measurements” by subscribing to the data acquisition topics in asynch data acquisition as described in section 1.10.5, then retrieve the actual path of the image file stored on the ZDMP Storage and get the image data from there.
The flow is illustrated in the following picture:
Industrial cameras generally consist of two basic components — the image sensor and the digital data transmission interface. capturing images at different resolutions (MP), speed (fps), with different sensor technologies (eg CCD or CMOS), and different interfaces (eg USB 3.0, GigE, or CameraLink).
GigE is the reference standard for the majority of industrial cameras, but generic libraries can cover as many cases and standards as possible, using GenICam, a Generic Software Interface which offers a universally valid software interface.
GenICam is made up of a range of modules:
GenApi: This defines the mechanism used to provide the generic API via a self-describing XML file in the device. It is also the name of the reference implementation of GenICam. Part of GenApi is the Schema, which defines the format of the XML file
SFNC: Acronym for Standard Features Naming Convention, this part standardizes the name, type, meaning and use of device features, so that devices from different vendors always use the same names for the same functionality. These features are typically shown in a tree view or can be directly controlled by an application. A related standard is the PFNC (Pixel Format Naming Convention) which defines how to consistently name pixel formats and lists the formats in use
GenTL: Standardizes the transport layer programming interface. It is a low-level API to provide a standard interface to a device regardless of the transport layer (with or without a frame grabber). It allows enumerating devices, accessing device registers, streaming data, and delivering asynchronous events
GenDC: This standard defines a portable Generic Data Container format. This allows devices to send any form of data (such as 1D, 2D, 3D, multi-spectral, metadata, …) in a Transport Layer Protocol (TLP) independent format and permits to share a common data container format for all the TLP standards
GenCP: The Control Protocol. This is a low-level standard to define the packet format for device control and is used by interface standards to save them needing to re-invent a control protocol for each new standard
To support adapter code in subscribing to data provided by the image acquisition devices, in fact, several Open-Source software libraries have been considered. In particular Aravis and Harvesters.
Aravis is a glib/gobject based library for video acquisition using GenIcam cameras. It allows interfacing with industrial cameras, and it also provides a set of utilities that help to debug the library.
Aravis currently implements the gigabit ethernet and USB3 protocols used by industrial cameras. It also provides a basic ethernet camera simulator. Harvesters is a Python library that helps to acquire images from a GenICam compliant camera through a GenICam compliant GenTL Producer library. It provides an end-to-end configuration interface for a broad spectrum of standard interfaces, including GigE Vision, USB3 Vision and Camera Link, covering almost all camera types and image formats.
This approach makes it easy to connect cameras compliant with the GenICam standard without the need for camera-specific configuration.
To use Harvesters, there is a need to install a GenTL Producer that works with Harvester, for example mvIMPACT Acquire.
mvIMPACT Acquire is the application programming interface (API) for MATRIX VISION hardware which is part of the driver package.
The programming interface can be used to control the hardware and to acquire the images (including to set the parameters).
The mvIMPACT Acquire package also provides:
mvDeviceConfigure, can be used to set the device ID and to update firmware
mvIPConfigure, to configure the network behaviour of GigE Vision devices and to determine and solve network issues
mvGigEConfigure, to install, remove or configure the MATRIX VISION GigE Vision capture filter driver