Process Assurance Run-time
General Description
The Process Assurance Run-time (PA Run-time) component is an end-user application for process quality assurance. At the core it enables the user to monitor and analyse the manufacturing process. Users can manage prediction and optimisation components, KPIs and alarms in separate collections (known as recipes). Alarms can be set which are triggered if failures are about to happen or simply notifications can be configured which are sent if certain criteria are met. If sufficient data is provided the PA Run-time component can even suggest specific action that should be taken to prevent future defects. To achieve these goals the PA Run-time uses internally different Prediction and Optimisation Run-time (PO Run-time) components each solving one specific data processing problem. This component interacts with several components in ZDMP platform, such as PO Run-time, Monitoring and Alerting and AI analytics Run-time.
| Resource | Location |
|---|---|
| Source Code | Link |
| X Open API Spec | Link |
| Video | Link |
| Online Documentation | Link |
Screenshots
Component authors
| Company Name | ZDMP Acronym | Website | Logo |
|---|---|---|---|
| Profactor GmbH | PROF | www.profactor.at |  |
| CETECK TECNOLOGICA SL | CET | www.grupoceteck.com |  |
Commercial Information
| Resource | Location |
|---|---|
| IPR Link | Link |
| Marketplace Product | Link |
Architecture Diagram
The following diagram shows the position of this component in the ZDMP architecture.
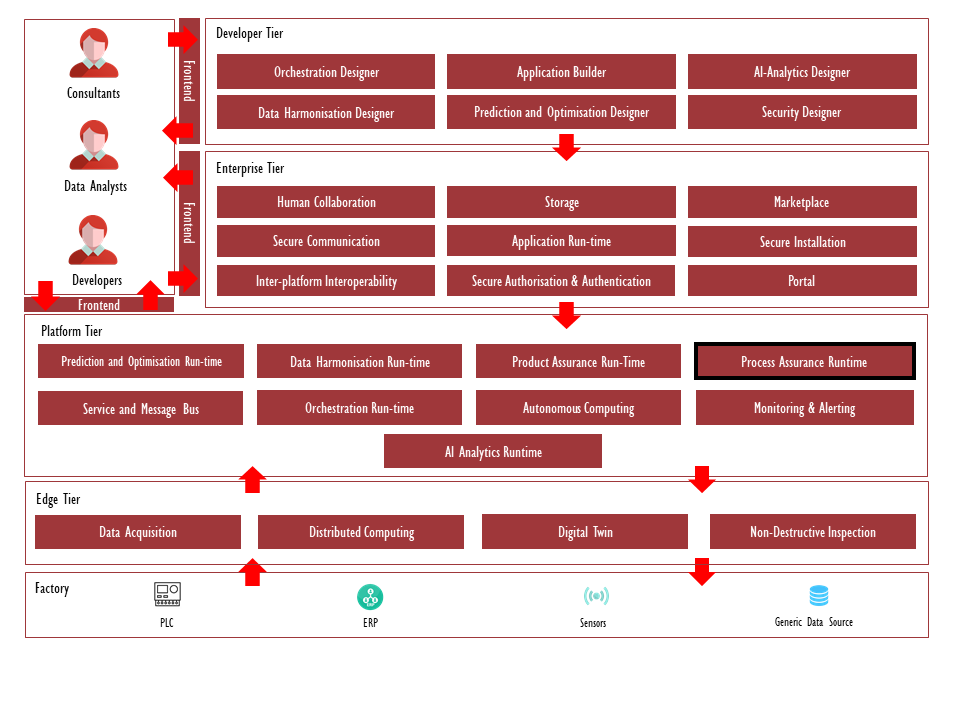
Figure 1: Position of Component in ZDMP Architecture
Benefits
Integration of process monitoring and control into ZDMP platform
Management of prediction and optimisation components, KPIs and alarms in separate collections (known as recipes)
Ability to learn from the expert actions
Application Run time providing Minizdmp platform that allows to deploy PO Run-time component locally.
Features
The key features are:
Interface to manage and configure PO-Runtime
Real time process monitoring
Query process optimisations or predictions
Configure alarms & notifications
Self-learning of control actions
Interface to manage PO Run-times
The user can view all available versions of the PO Run-time component that are saved in a registry. Each version can be deployed which creates a new instance of the specific PO Run-time version. Once an instance is deployed it can be configured, started, or stopped. For this the PA Run-time component provides a flexible UI that assists the user where possible. For example, the configuration UI automatically queries the parameters that need to be set from the running PO Run-time instance and displays them on the UI.
Real time process monitoring
Users can set-up KPIs to keep track of any data provided by the message-bus, including quality predictions or raw sensor data. A KPI is automatically configured for any message-bus data that is used as an input or output by a running PO Run-time instance. All configured KPIs can be inspected using the Grafana UI.
Query process optimisations or predictions
The Process Quality Assurance Run-time keeps track of all running PO Run-time components the user has connected. For every Prediction and Optimisation Run-time the user can trigger a onetime computation at any point. The result is, independent of the original output configuration, displayed in the PA Run-time UI.
Configure alarms & notifications
The user may choose to set-up alarms that will send a notification once a predefined situation occurs. This could be, for example, the product quality dropping, or an anomaly being detected.
Self-learning of control actions
An instance of a PO Run-time component is specialized to learn to control a specific device by observing the process values and the control actions that are taken by an expert. The computational layer of the PO Run-time consists of an incremental learning algorithm that learns to map the process values to actions that are taken by operator. This PO Run-time is shipped with Process Assurance Run-time component; however, it could be modified and re-packaged using PO designer.
System Requirements
The component may be run on any platform that supports Docker images. Furthermore, to use all features, the following dependencies inside the ZDMP platform exist:
Prediction and Optimisation Run-time: Used as computational units that perform predictions or optimisations
Message Bus: Used to get real time data, eg predictions on process quality
Storage: Used for persistence
Monitoring and Alerting: Used to forward notifications to the user and for a flexible plotting facility (Grafana)
Associated ZDMP services
Required
Optional
Installation
Once bought in the Marketplace, the component is available for installation through the Secure Installation component. Some installation variables can be set:
“Private Registry settings”
“Private Registry URL”: the ZDMP container registry URL
“Private registry user/password”: the login for the ZDMP container registry
“Backend - values”
“name”: configure backend deployment name
‘’port”: Backend expose port number
“version”: Latest version of backend image
“Backend – Authentication”
“The realm this instance is referenced to”
“The ZDMP storage component URL”
“The URL path of Monitoring and Alerting component”
“The URL path of KEYCLOACK”
“The URL path AI Analytics Runtime”
“Backend - Ingress”
“Enable Ingress”: enable Ingress
“Ingress Host”: URL of the Runtime Backend component
“Ingress Path”: Leave default
“Frontend UI - values”
“name”: configure backend deployment name
‘’port”: Backend expose port number
“version”: Latest version of backend image
“Frontend - Ingress”
“Enable Ingress”: enable Ingress
“Ingress Host”: URL of the Runtime Frontend component
“Ingress Path”: Leave default
Installing from source in Local Environment
The installation is achieved by running a simple Docker-compose command. To start the complete Process Assurance Run-time component, use the following:
- Start using Docker-compose:
```bash
docker network create zdmp
docker-compose up –build
The started services can be tested using the following URLs:
Frontend URL:
Backend URL (Swagger UI for test purposes):
Installing from Minizdmp in Local Environment
The installation is achieved by following the documentation to install the setup on the local environment. To deploy the Process Assurance Run-time component, use the specific helm chart version URL:
| Resource | Location |
|---|---|
| Minizdmp documentation | Link |
| Helm Chart Version | V1.0.11 |
How to use
Performance Monitoring
The Process Assurance Run-time uses so called recipes to manage process monitoring. A recipe is a collection of configurations of the following form:
```json
{
“rules”: [
{
“config”: {},
“name”: “string”,
“type”: “string”,
(“uri”: <uri>)
},
…
],
“status”: “off”
}
It has a JSON list of rules. Each rule has ‘name’ a ‘config’ and a ‘type’, where the ‘type’ is either ‘PO’, ‘KPI’ or ‘Alarm’. In case the type is ‘PO’ the URI of the specific instance must be specified. The ‘config’ key is also a JSON that contains the configuration details, eg the configuration of the PO Run-time (inputs, output, etc.). See the documentation of the PO Run-time component and the Monitoring and Alerting component for details on these configurations. Finally, a recipe has a ‘status’. If the ‘status’ is switched ‘on’ the Process Assurance backend will start and configure all PO Run-time instances and also set-up all KPI and Alarms. If the status is set to ‘off’ everything is deleted, and the PO Run-time instances are switched off.
A recipe with three rules, one for each type may look like this:
```json
{
“rules”: [
{
“config”: <JSON PO-config>**,**
“name”: “name of PO-configure”,
“type”: “PO”,
“uri”: <uri>
},
{
“config”: <JSON KPI-config>**,**
“name”: “name of KPI-configure”,
“type”: “KPI”
},
{
“config”: <JSON Alarm-config>**,**
“name”: “name of Alarm-configure”,
“type”: “Alarm”
}
],
“status”: “off”
}
The following section shows how to configure an anomaly detector (PO Run-time) and configure an alarm that will send an email if an anomaly is detected.
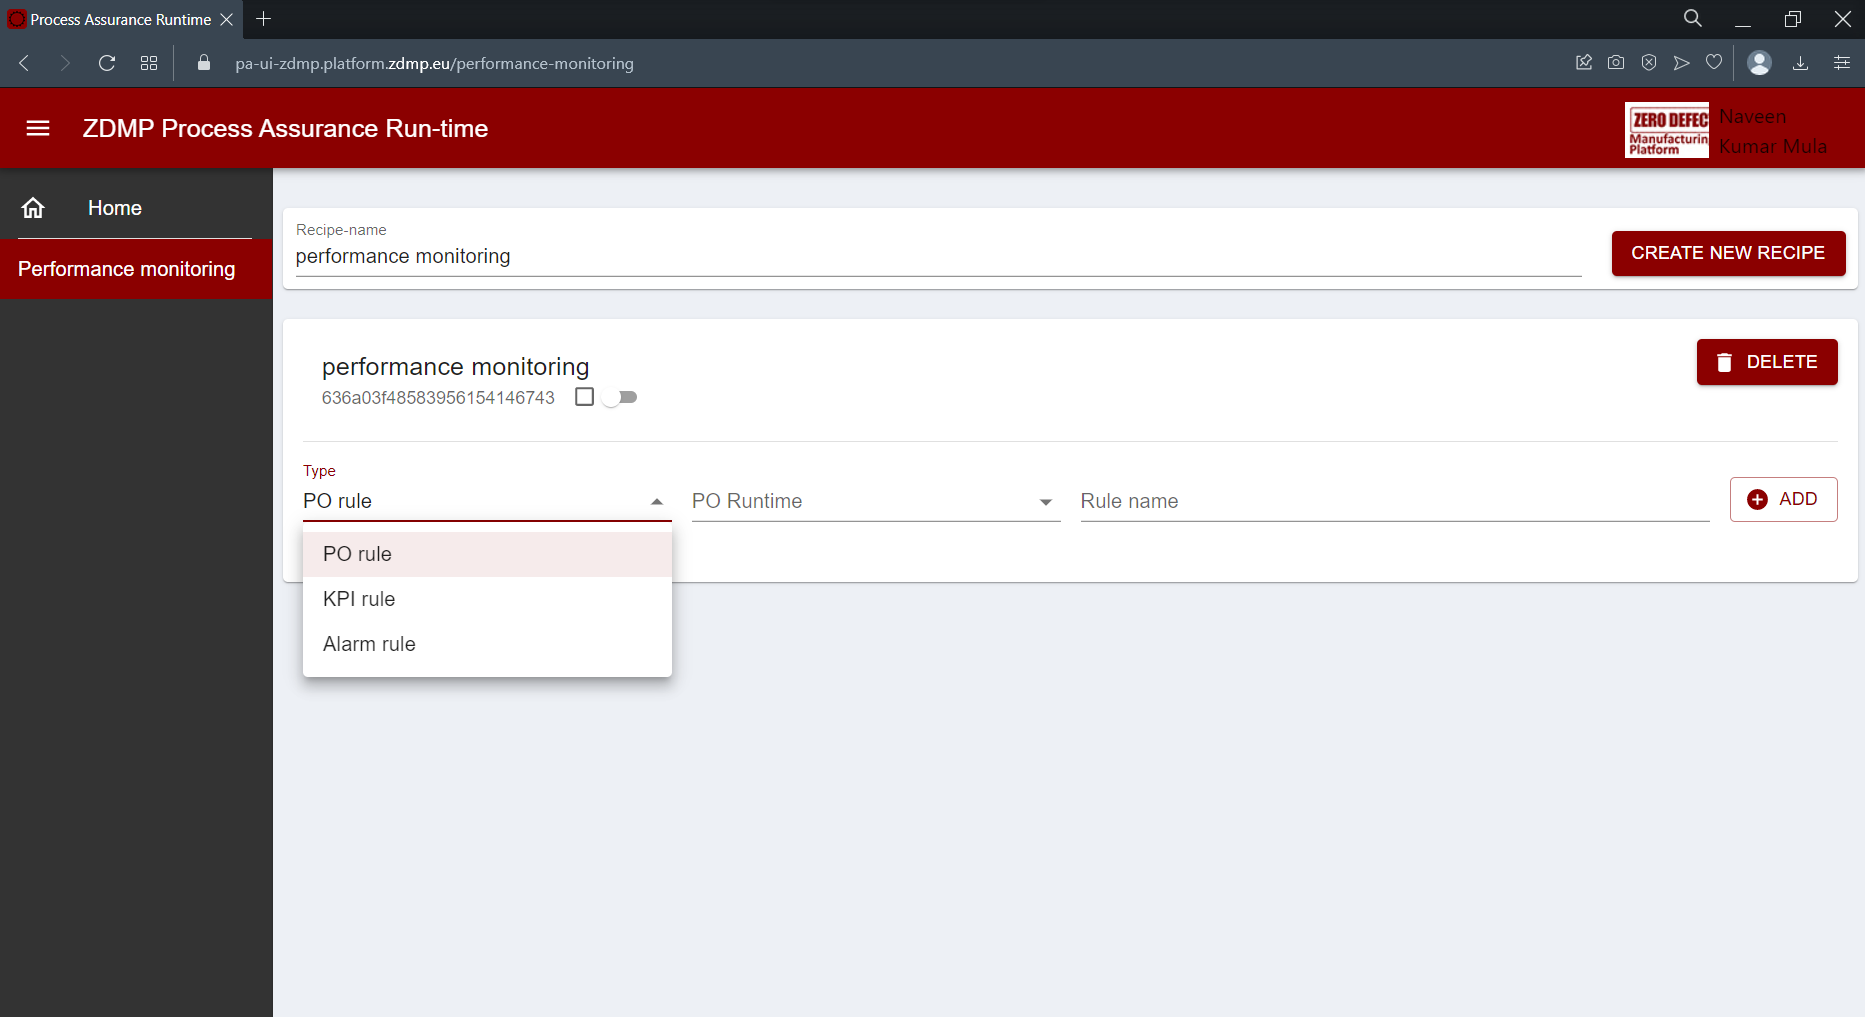
First a new recipe is created by clicking on the button ‘Create new recipe’ in the top right corner. In the UI each card corresponds to a recipe. Each line in a card is a ‘rule’. In the image below, the ‘type’ of the rule to be added can be selected:
In the case of a PO Run-time the UI displays all running instances:
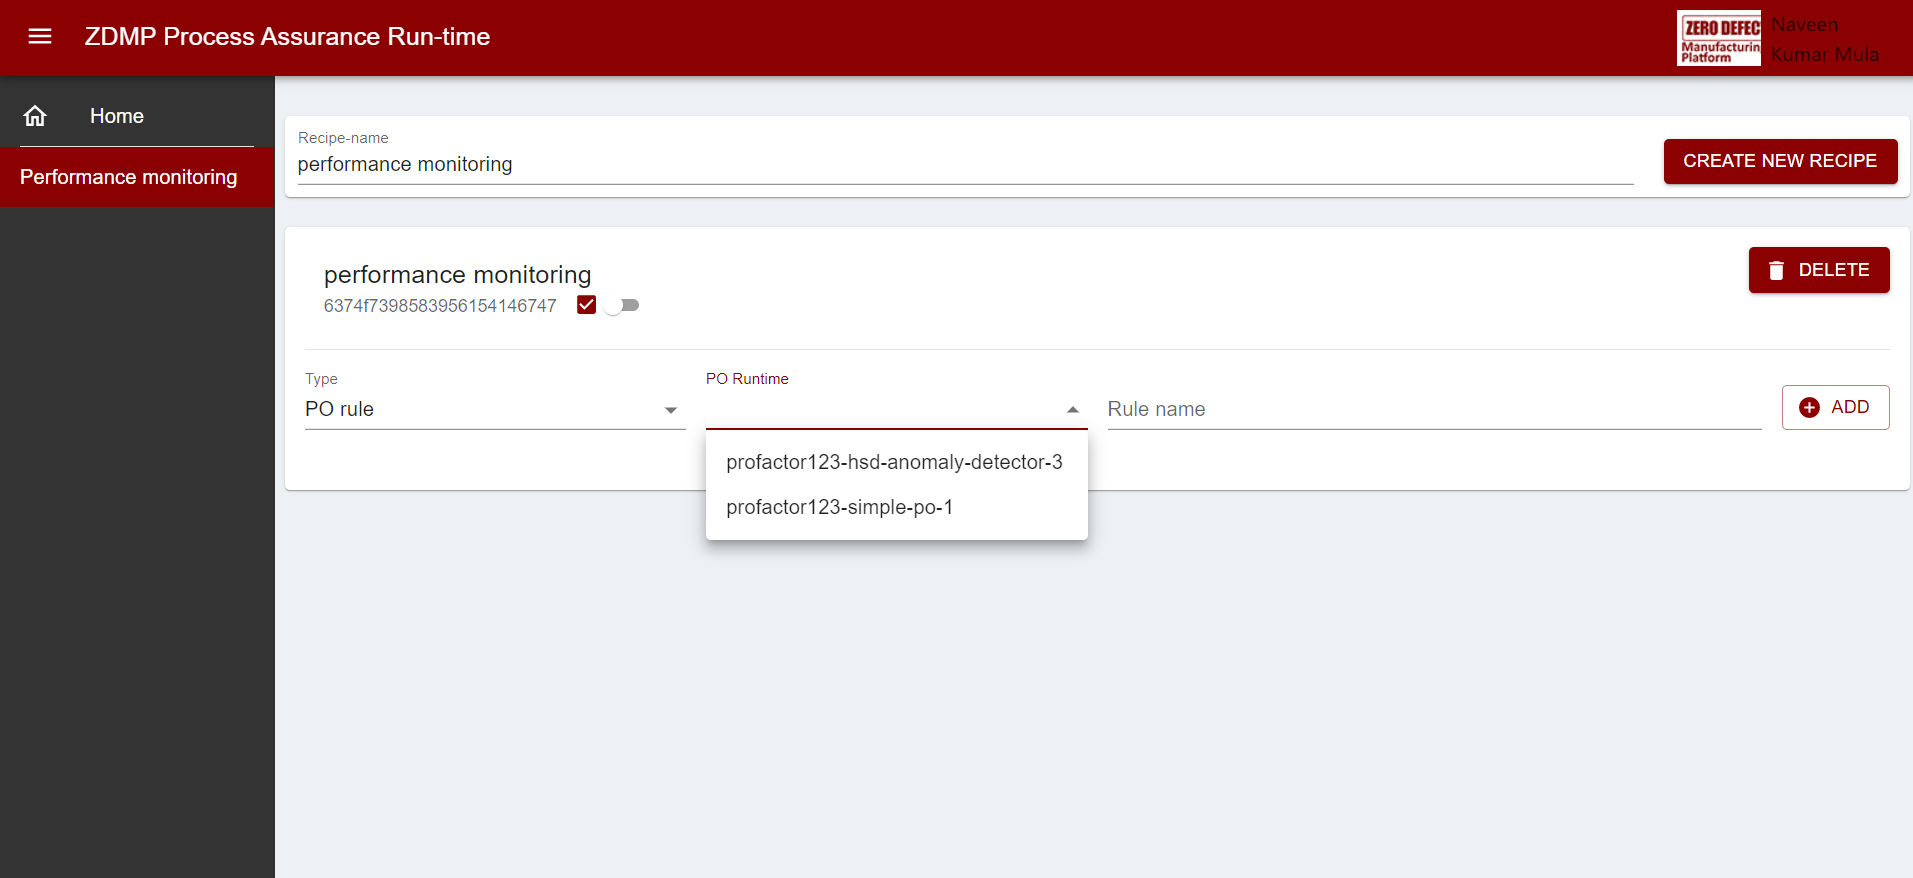
By clicking on the newly created ‘rule’ one can configure it:
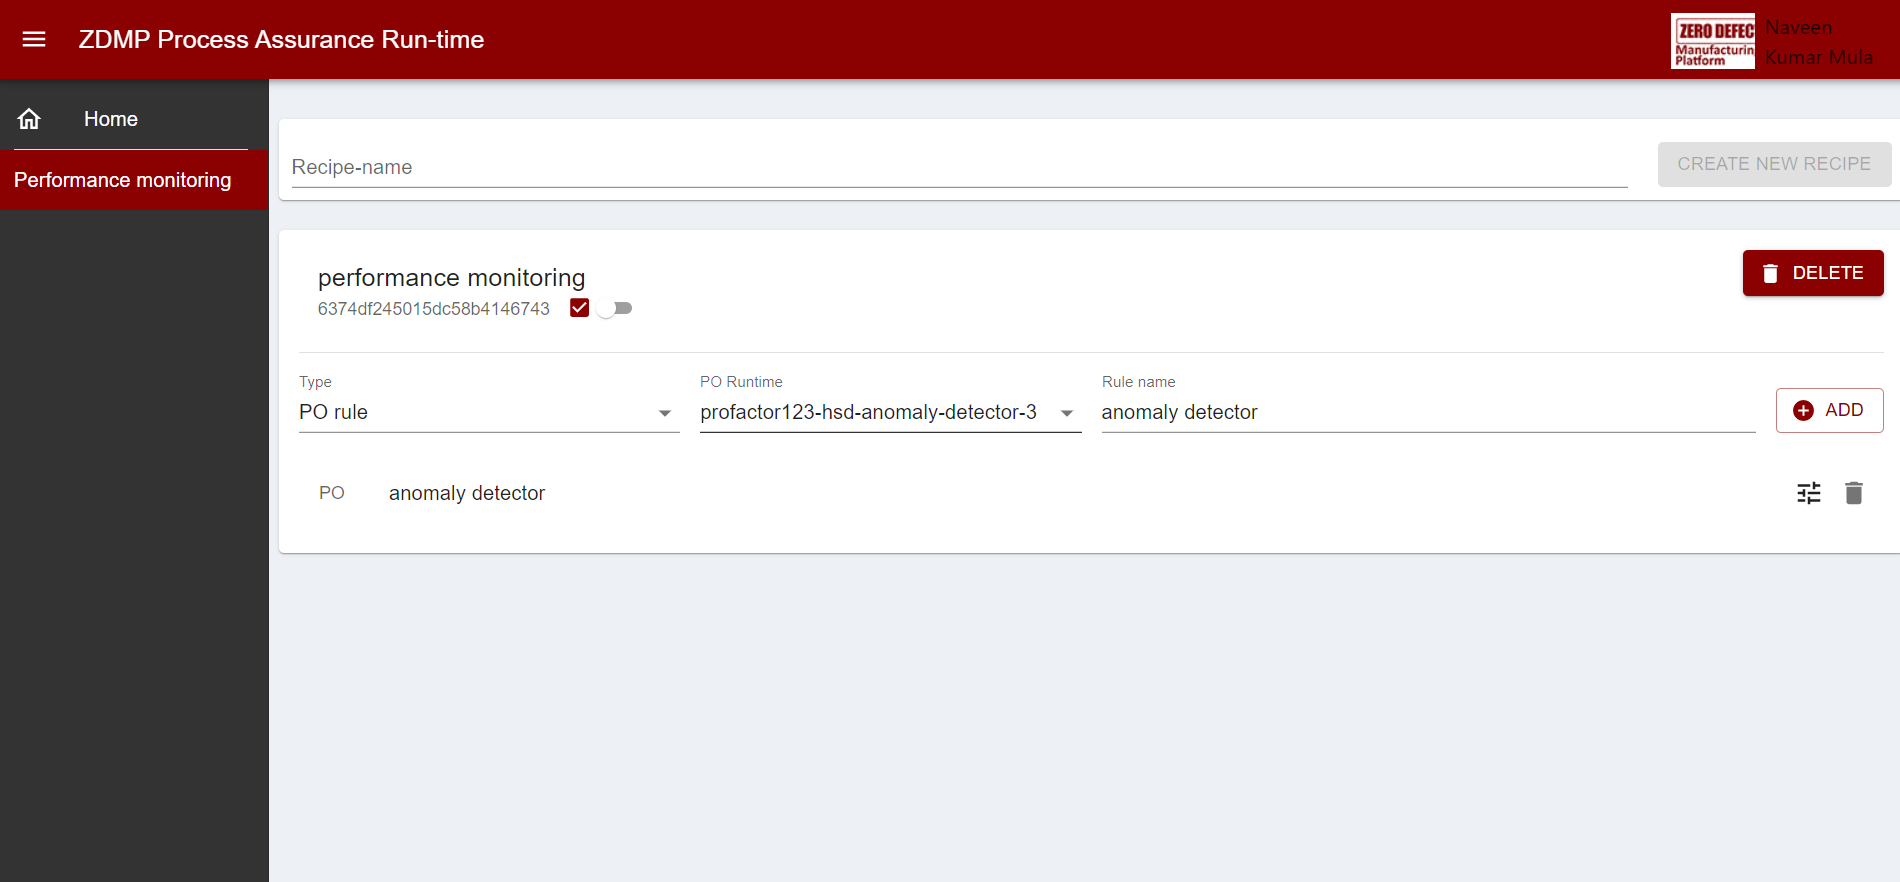
Here the configuration of the PO Run-time is already completed. In the following figure, one can see 4 input parameters of type ‘mqtt’ (type ‘in’) and one output parameter also of type ‘mqtt’ (type ‘out’). Each parameter can later be modified or deleted.
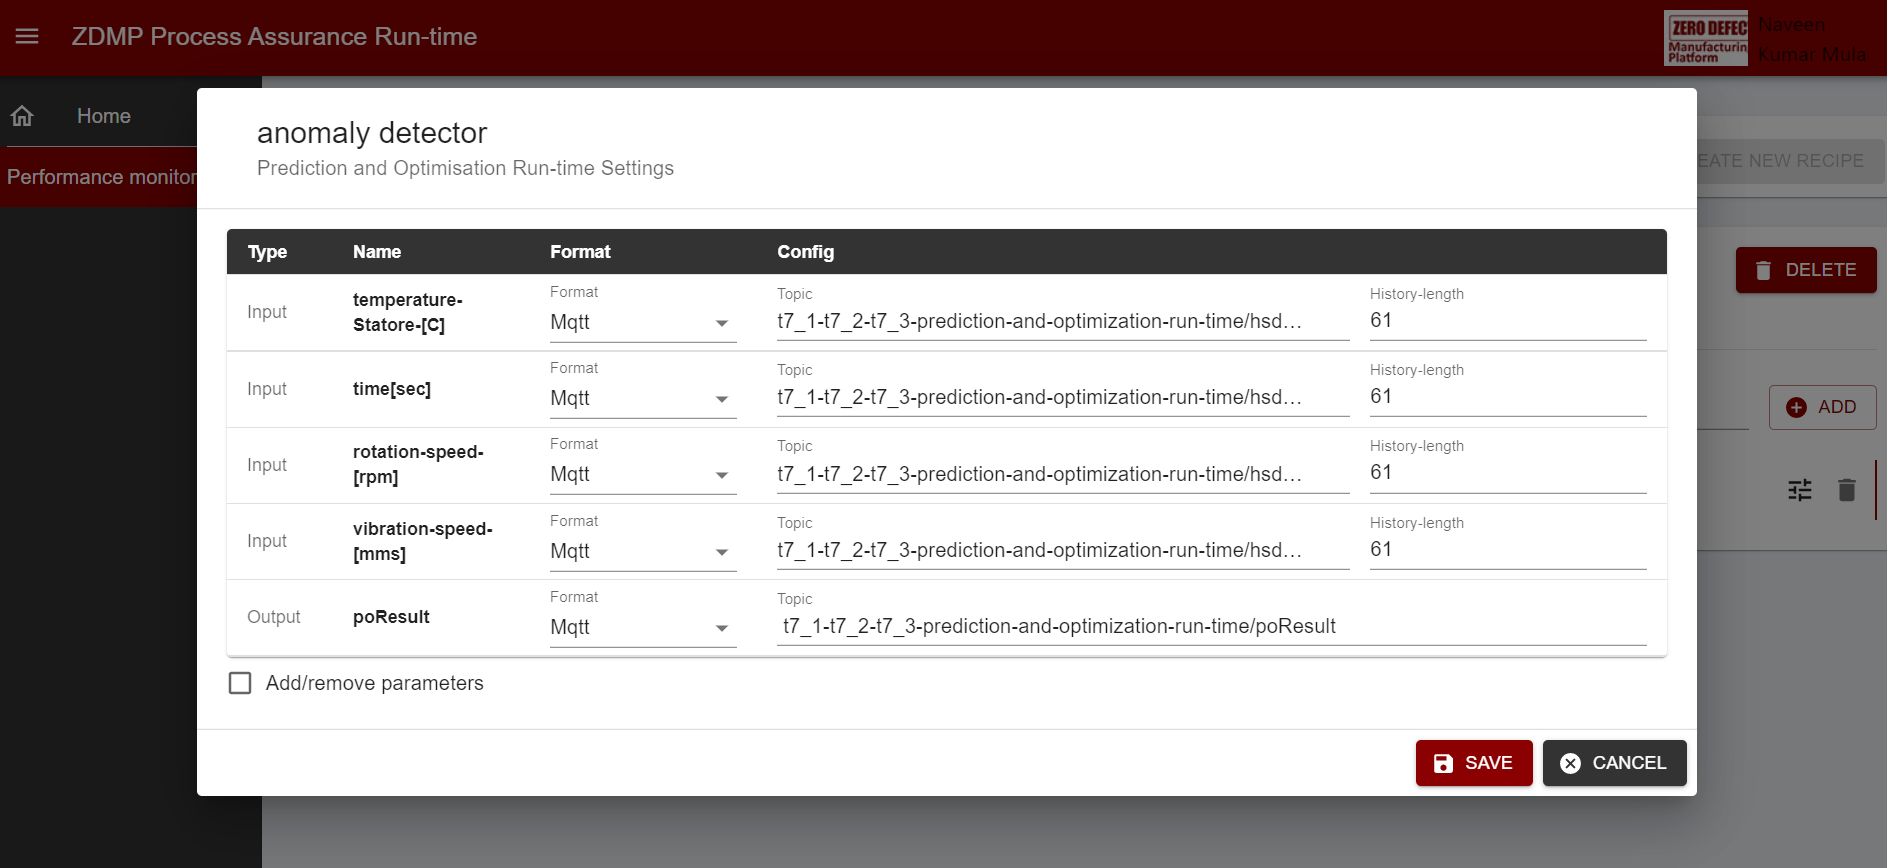
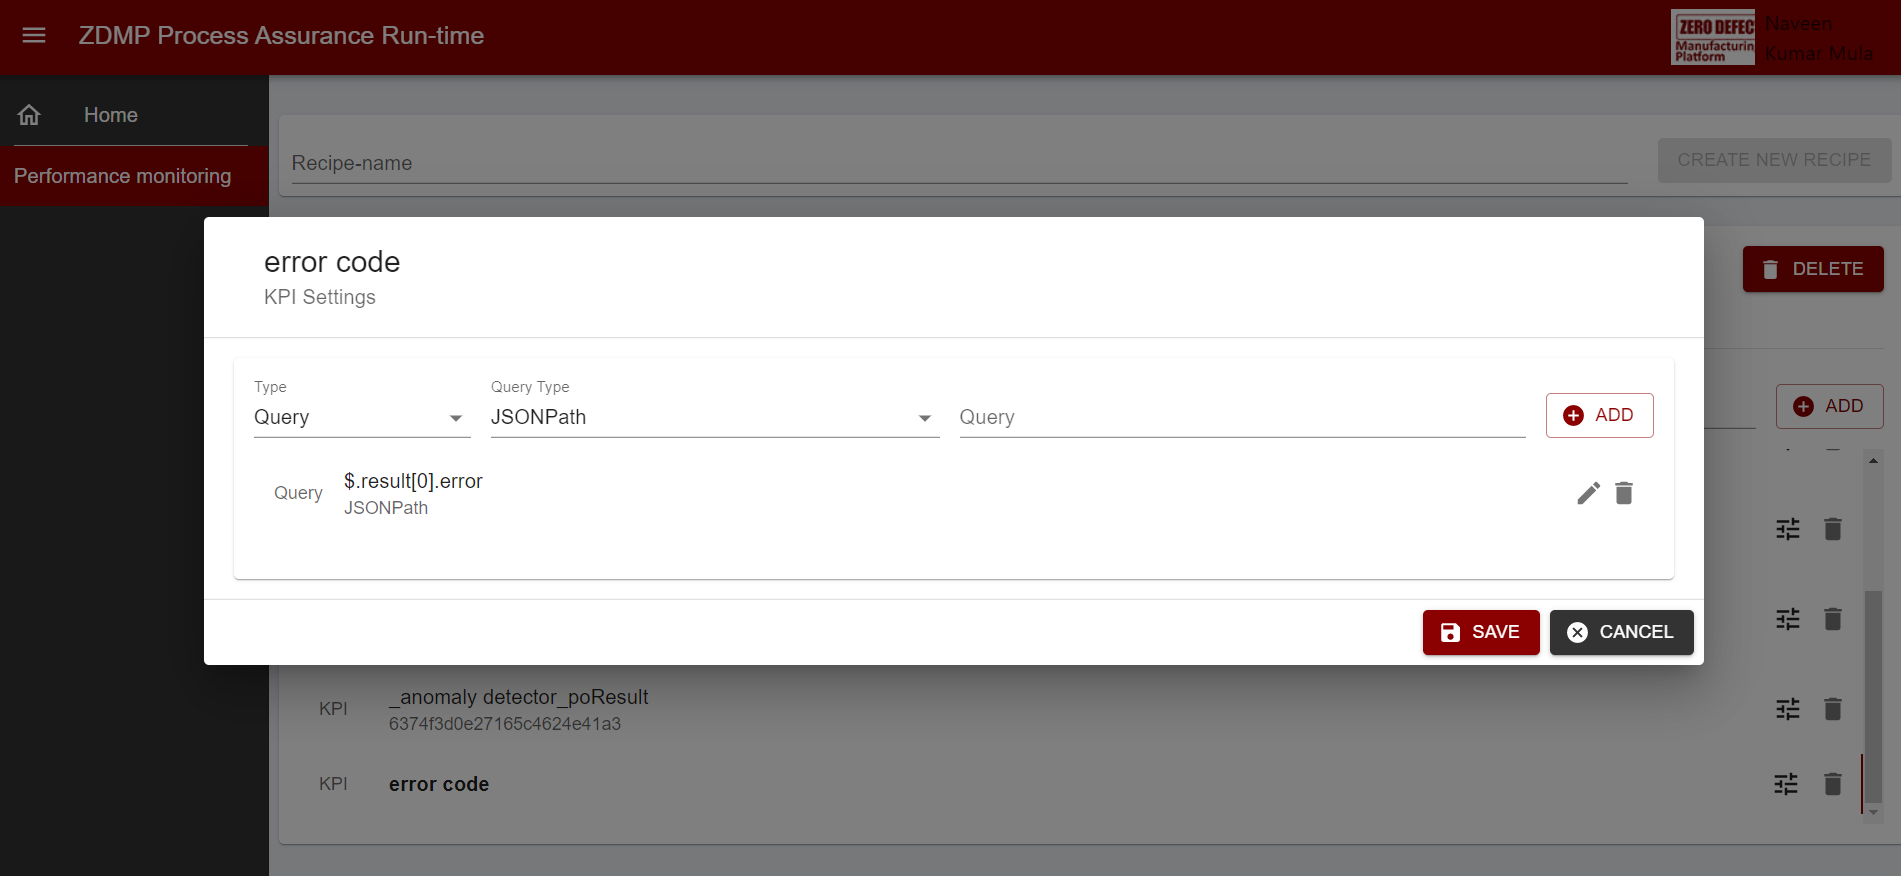
In this case the result of the anomaly detector is a JSON that is configured to be written onto the message bus. Next, KPI is added that extracts the error code from the previously specified topic:
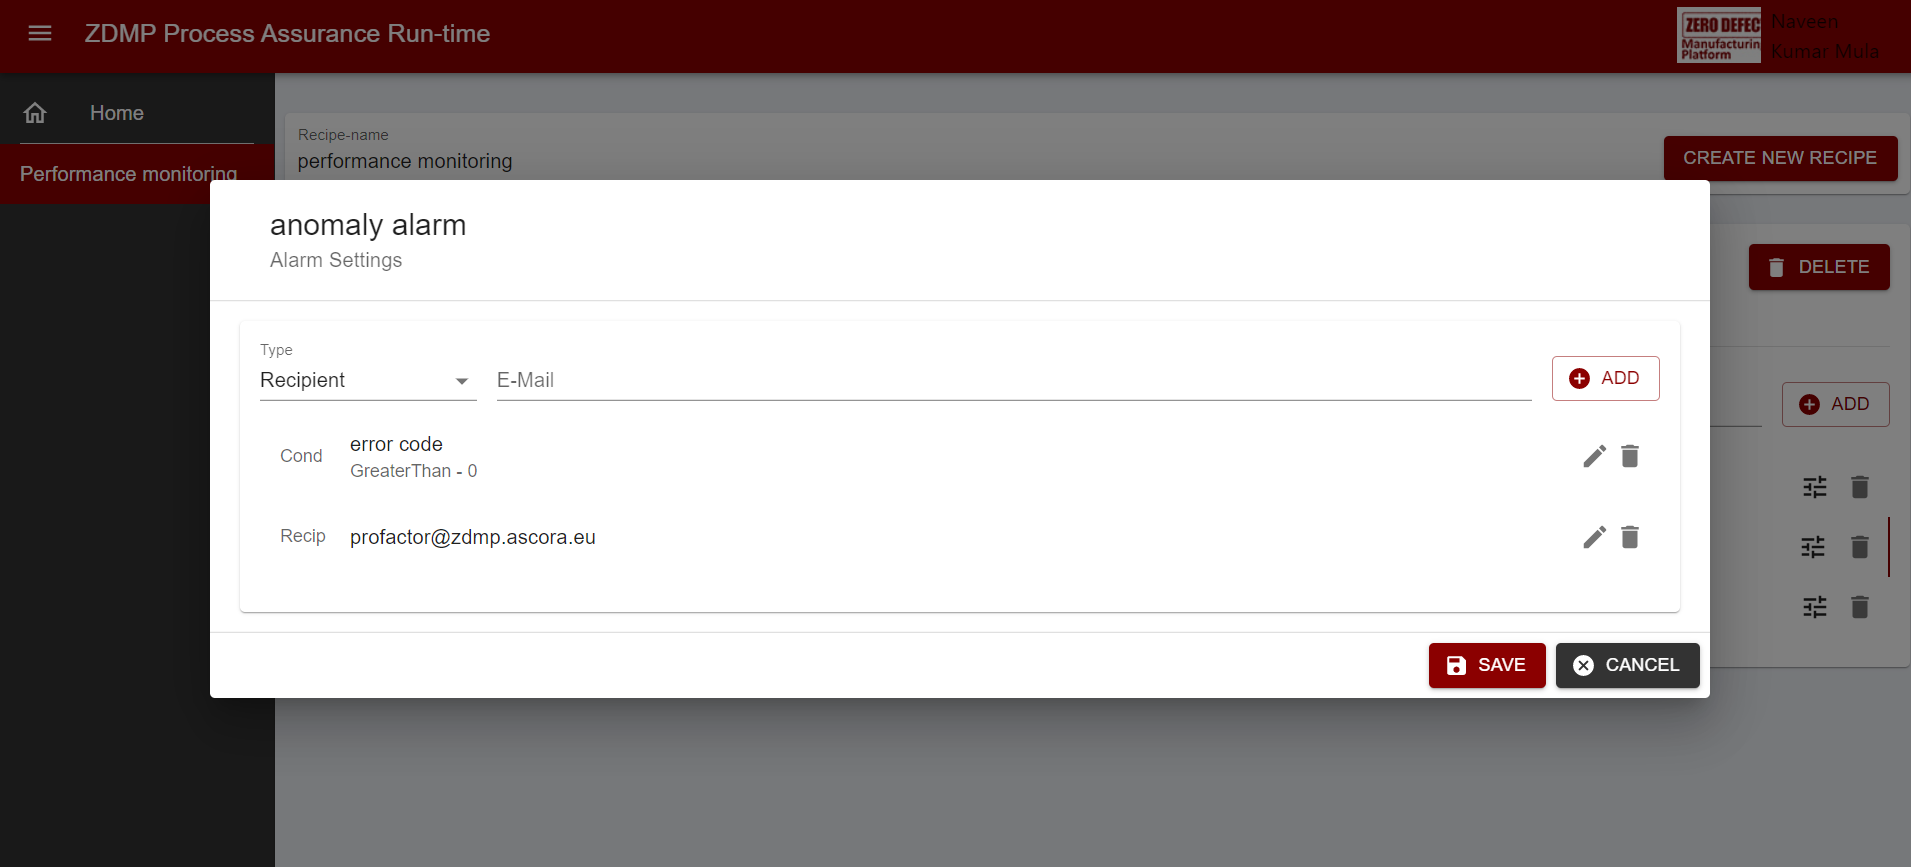
Finally, an alarm can be set-up. For this, an email as well as a condition which will trigger the alarm must be specified. By checking the switch ‘status’ the recipe is enabled:
Grafana can be used for plotting the KPI’s. See here for more details.
Self-learning
This feature requires the following subcomponents:
A device or a simulator that can receive commands through message bus and can publish its process values on message bus
A prediction and optimisation component that is specialized for self-learning (learner)
A controller that can observe the process values, send the control commands, and see the suggestion created by learner
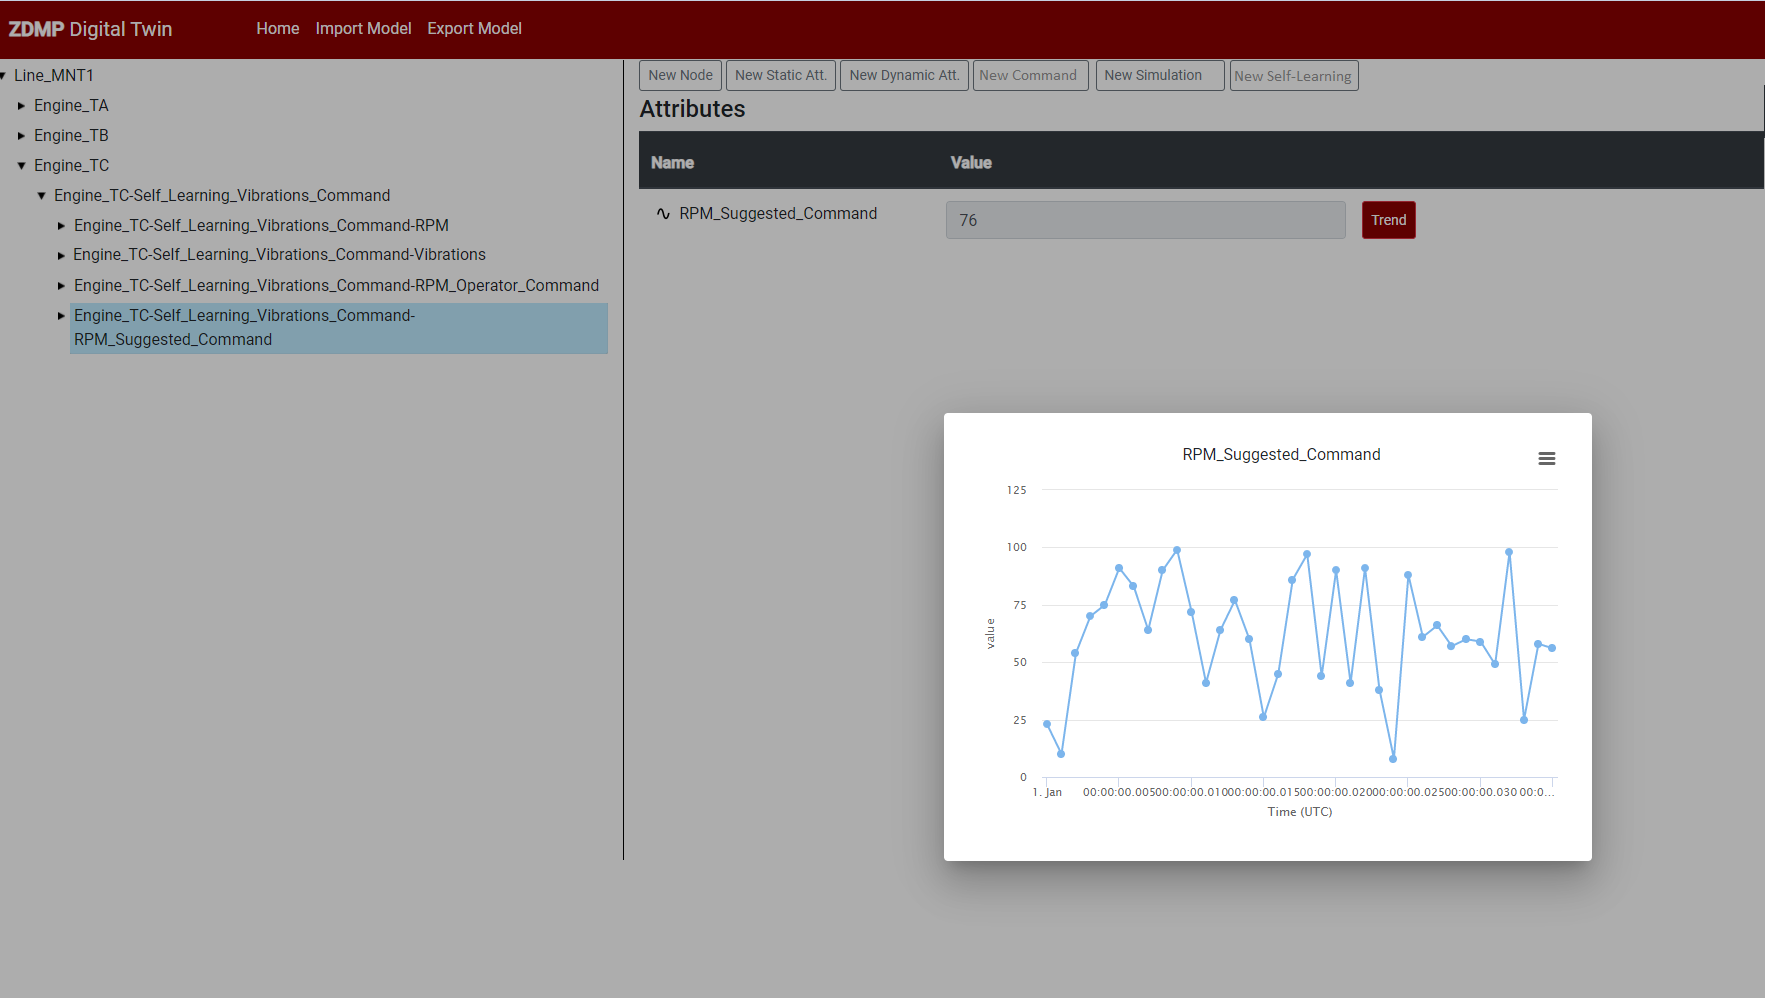
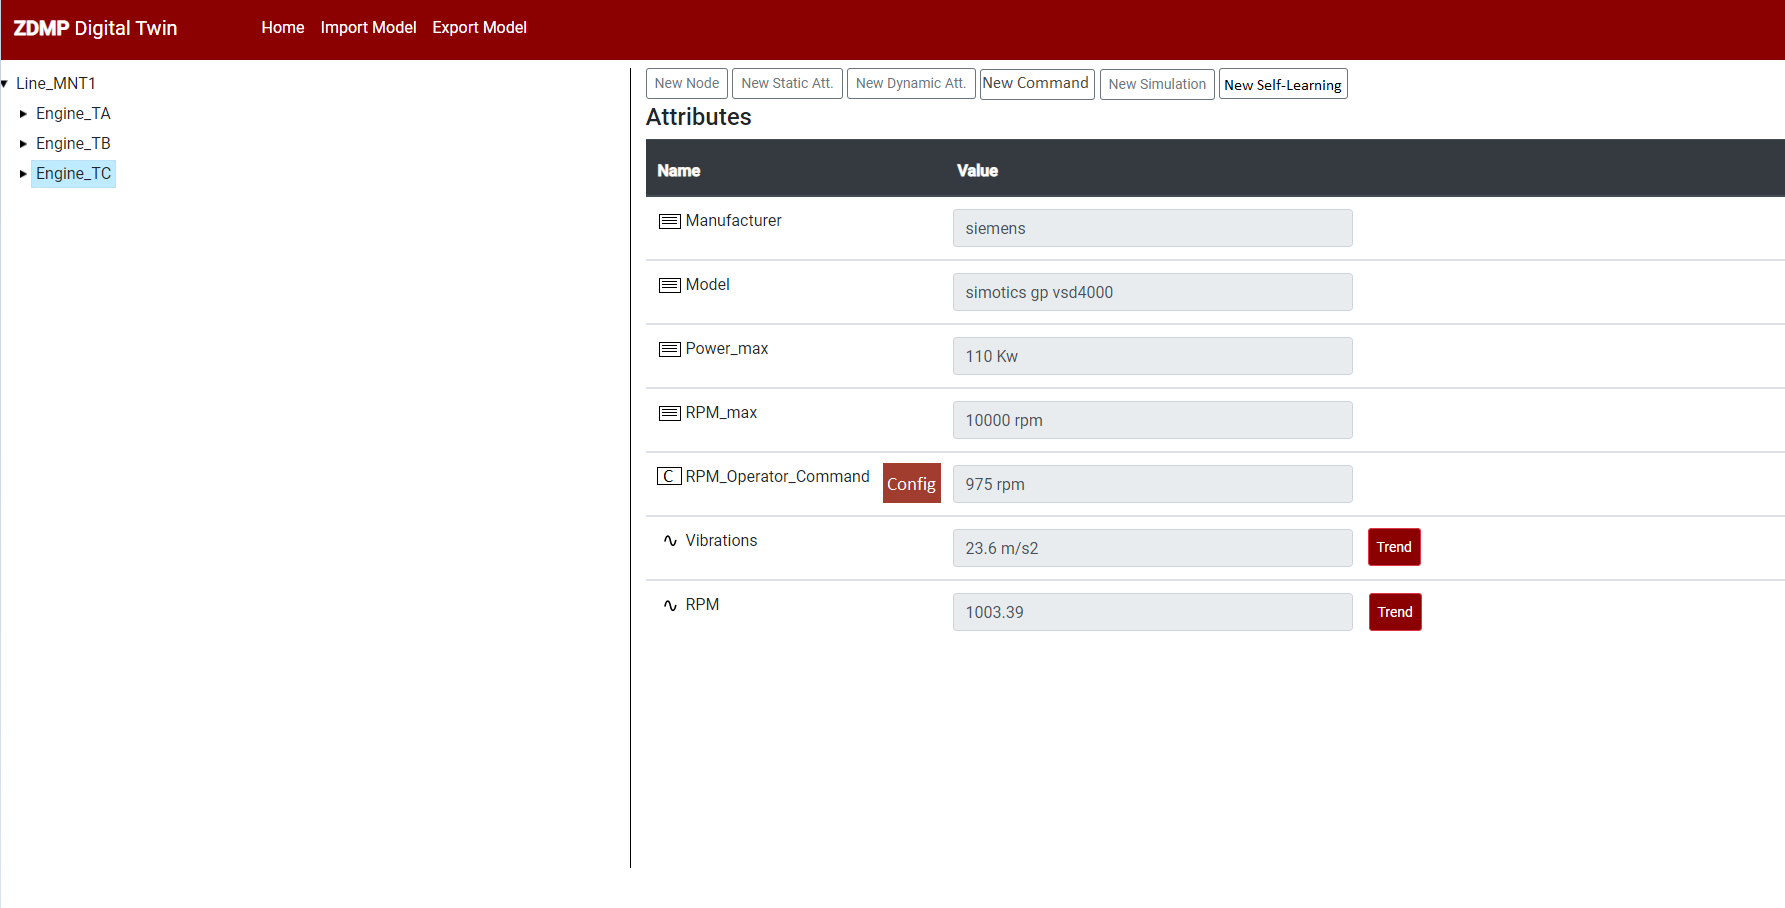
Currently a version of controller is implemented in the digital twin modeler component. This feature in the digital twin modeler connects topics on message bus to dynamic attributes of a device and provides a user interface to see the process values and control commands (which might be sent by other controllers) that are received from message bus and sends the control commands. The message bus topics which are connected to attributes of the device are discovered at the time of associating a learner (that is a prediction and optimization component managed by AI analytics runtime) to the device.
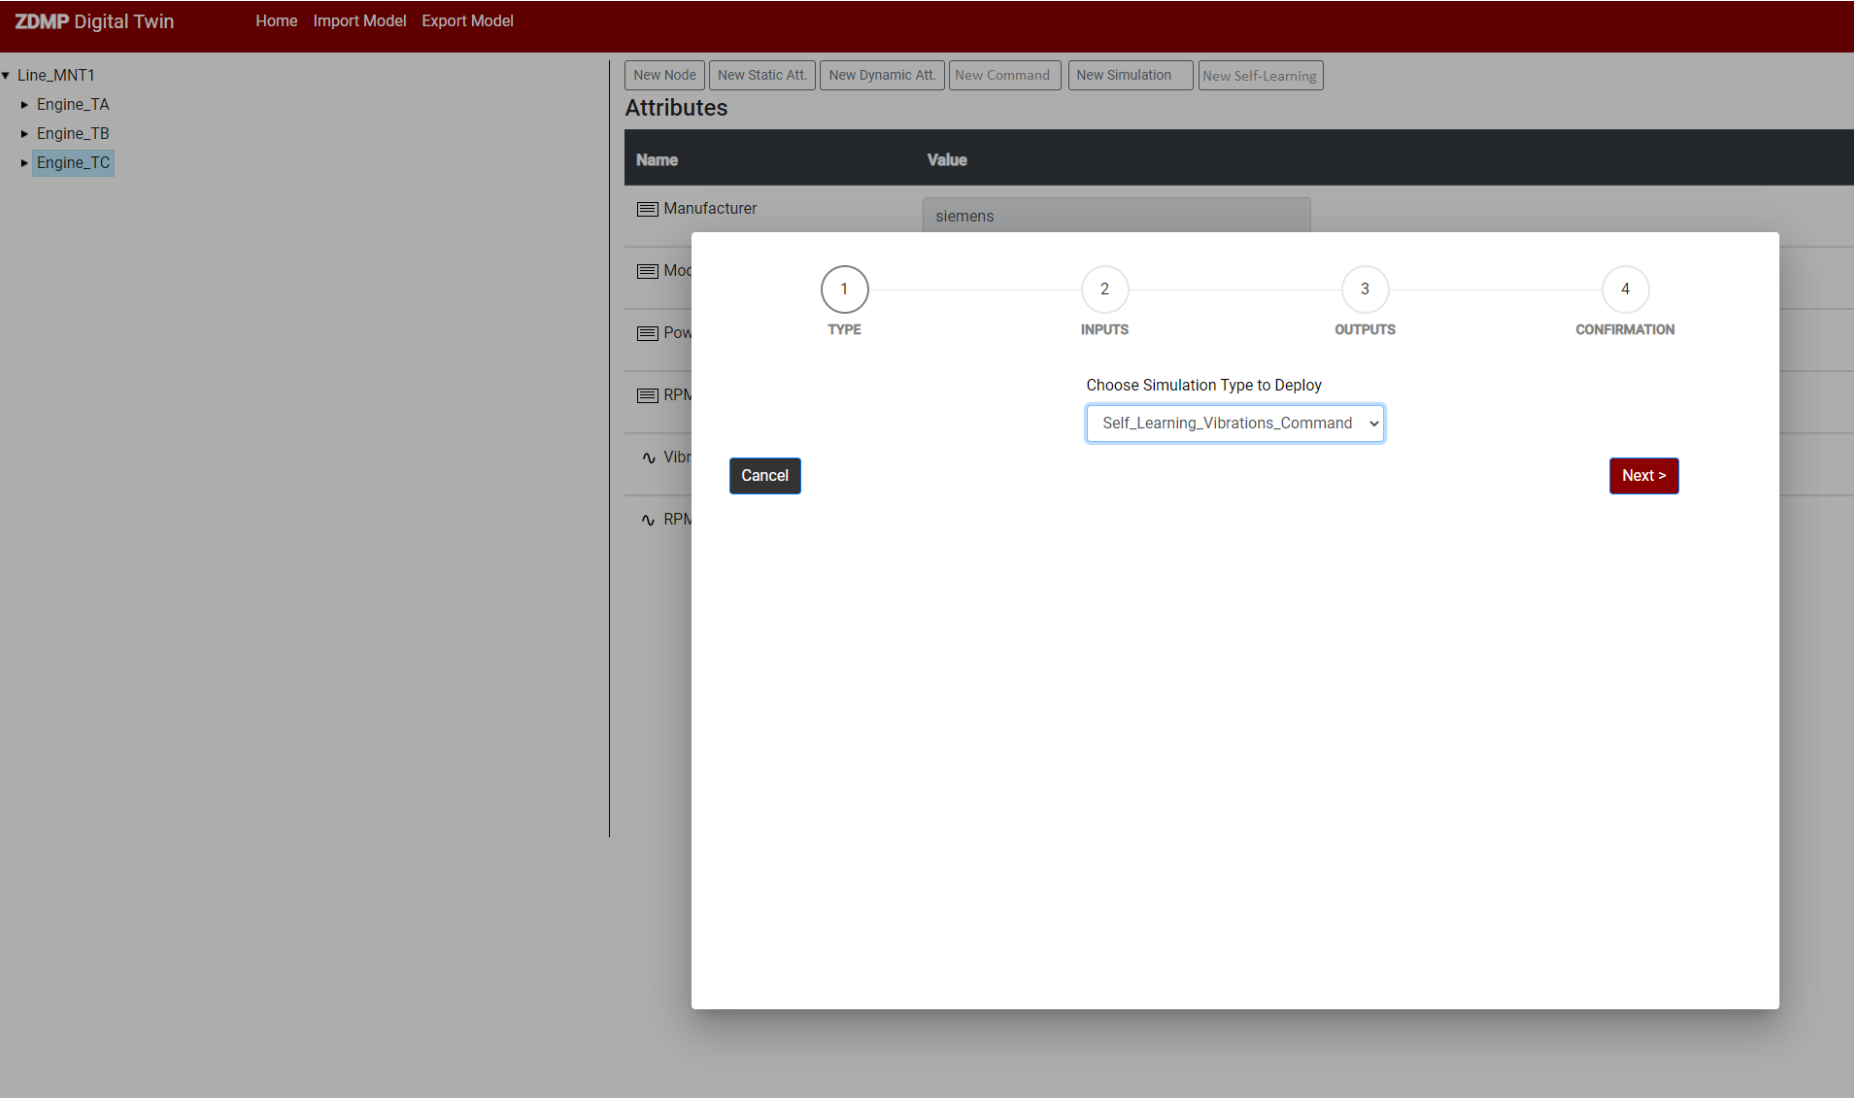
In the following figure the process values and the control command (RPM_Operator_command) are shown. To connect a learner to this model, by pressing the “New self-learning” button, a wizard will open
Then, in the first step the learner is selected.
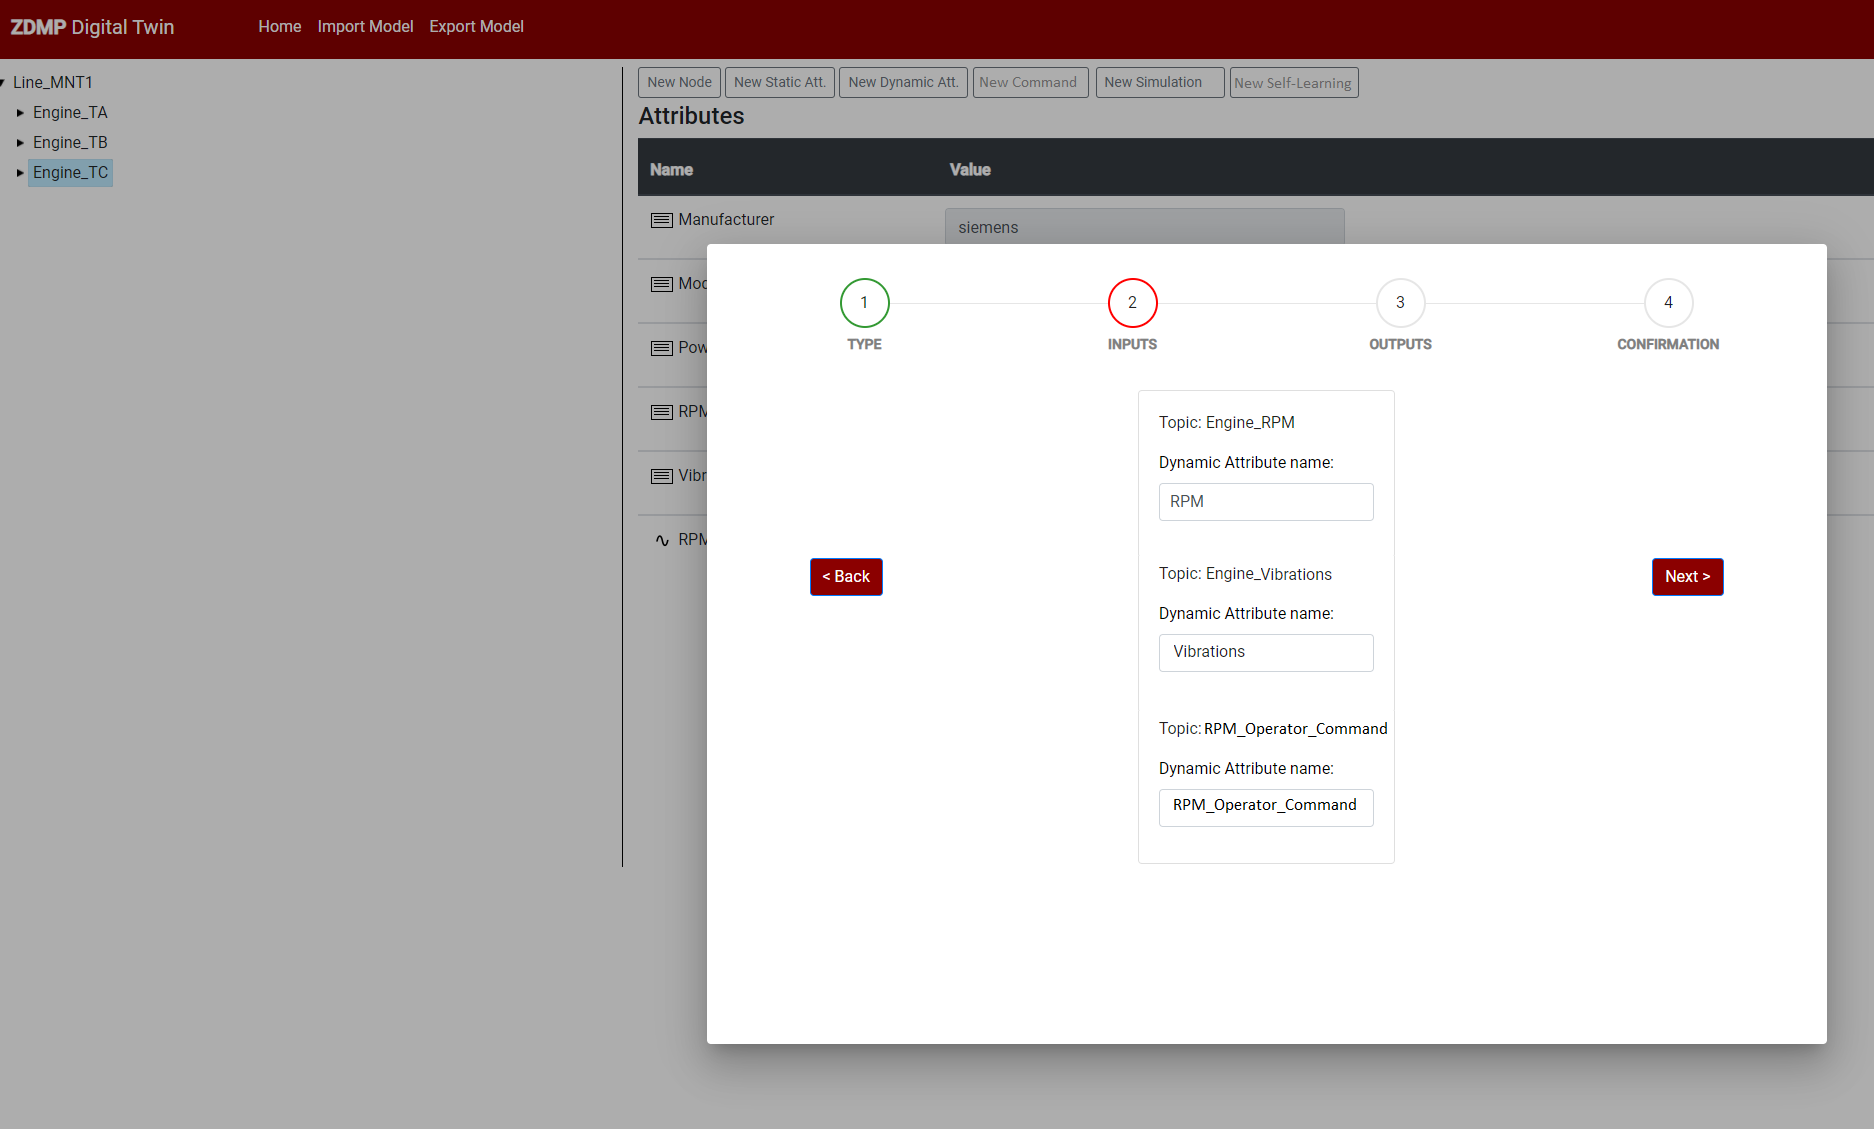
In the second step the input message bus topics of learner are related to attributes of the device.
Next step the output topics are associated to the corresponding attribute of the device.
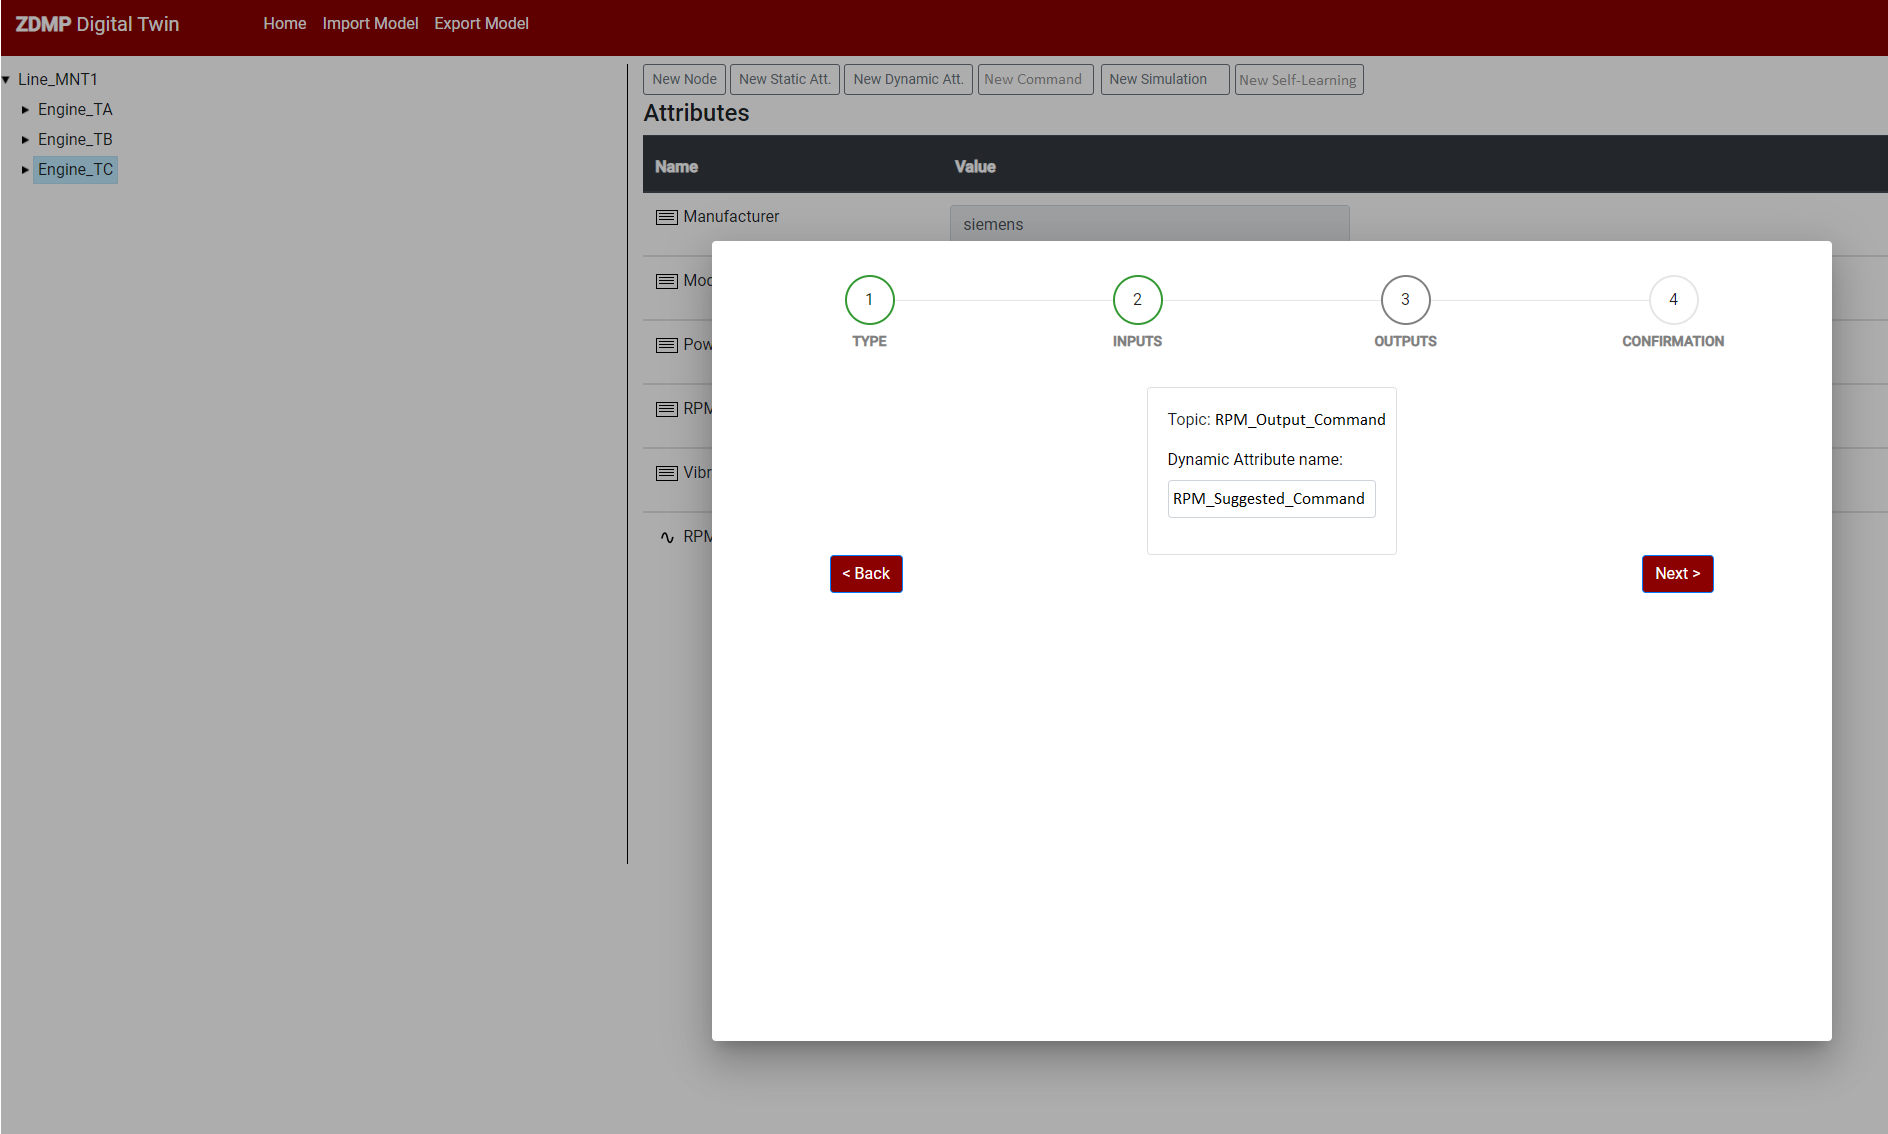
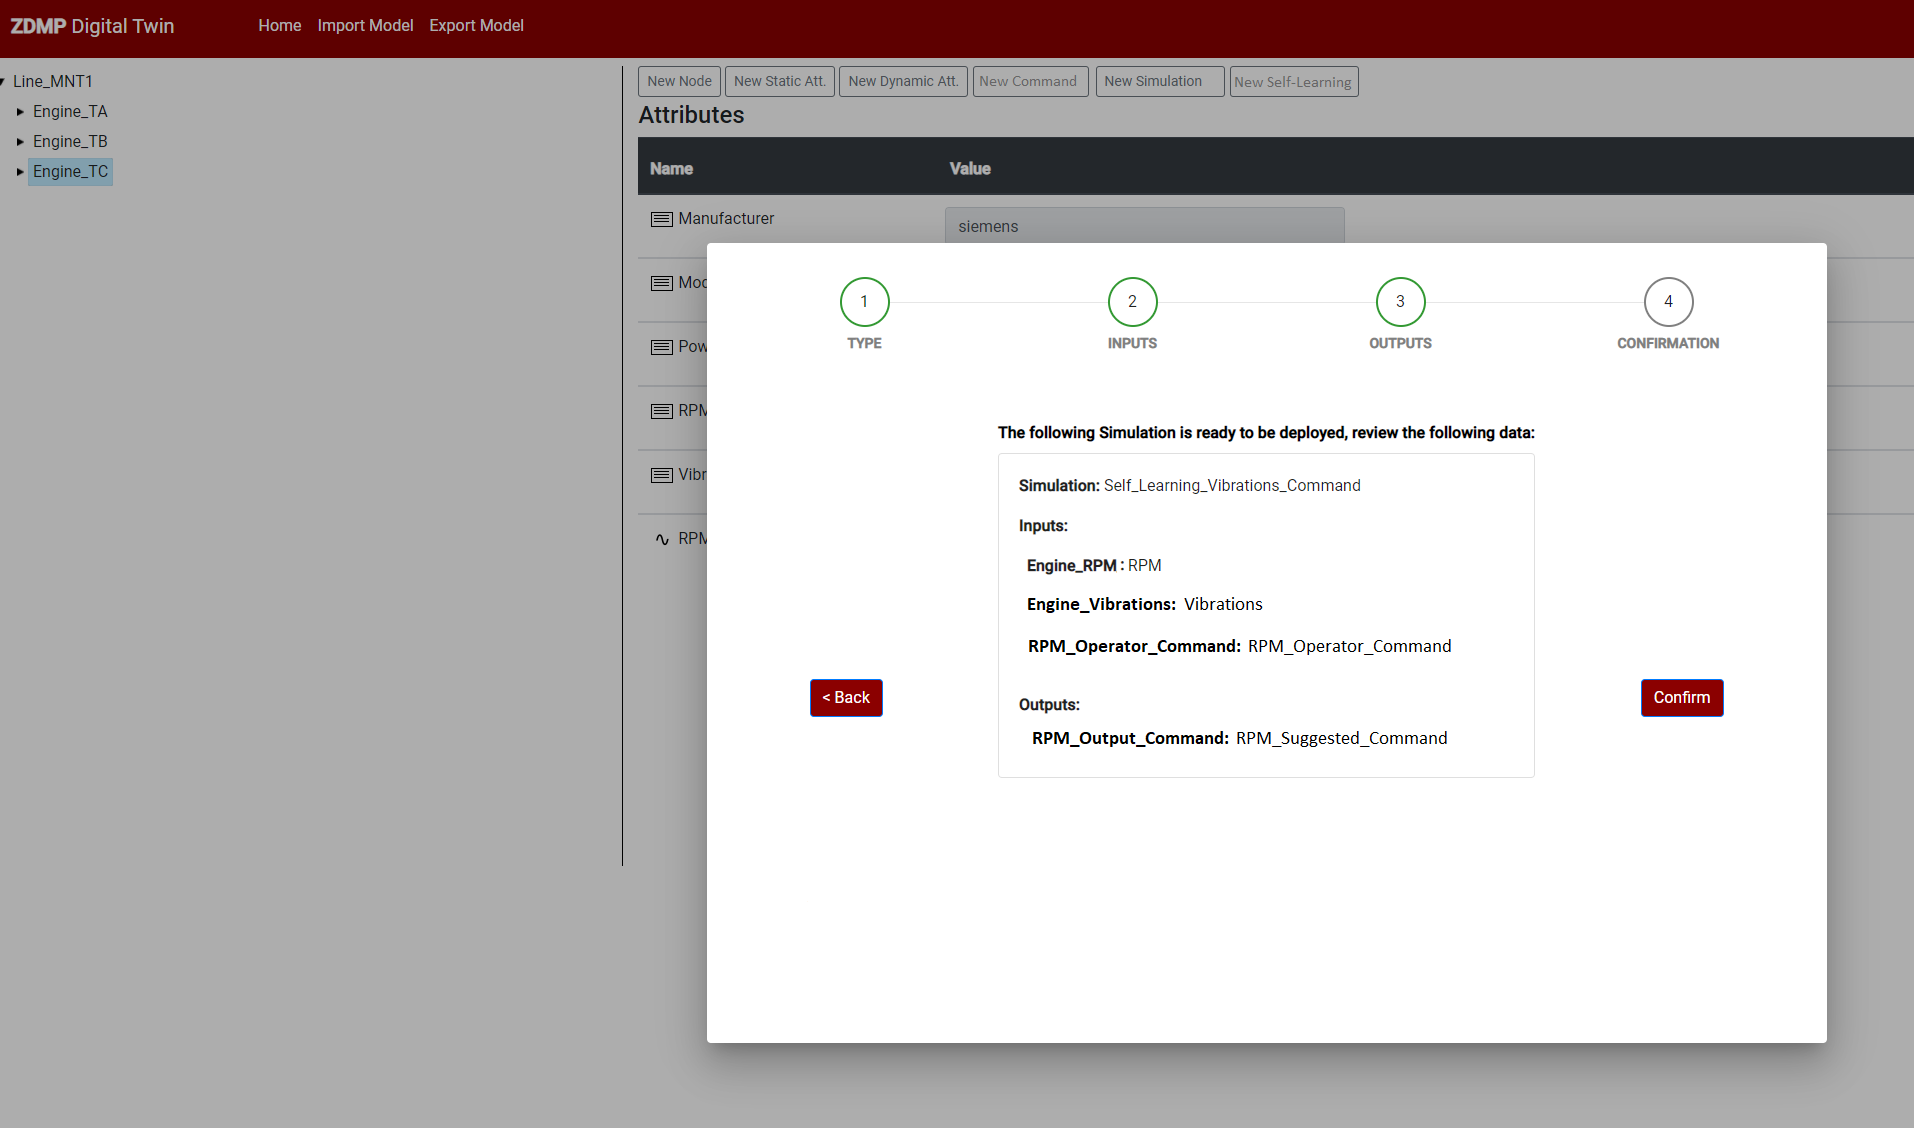
The last step shows the summary for confirmation.
In the following figure the device node is expanded and one of the attributes is shown in detail: